Hello, this is Ryuta Hamamoto from TIMEWELL.
A SaaS renewal quote lands, the number is higher than last year, and the same thought comes up: at this price, wouldn't it be cheaper to build it ourselves? With all the talk about generative AI speeding up development, it comes up even faster. But if you put the annual fee next to a development estimate and write the approval request on that basis, you will usually get the answer wrong. The comparison window is too short, and only half of the build-side costs are in it.
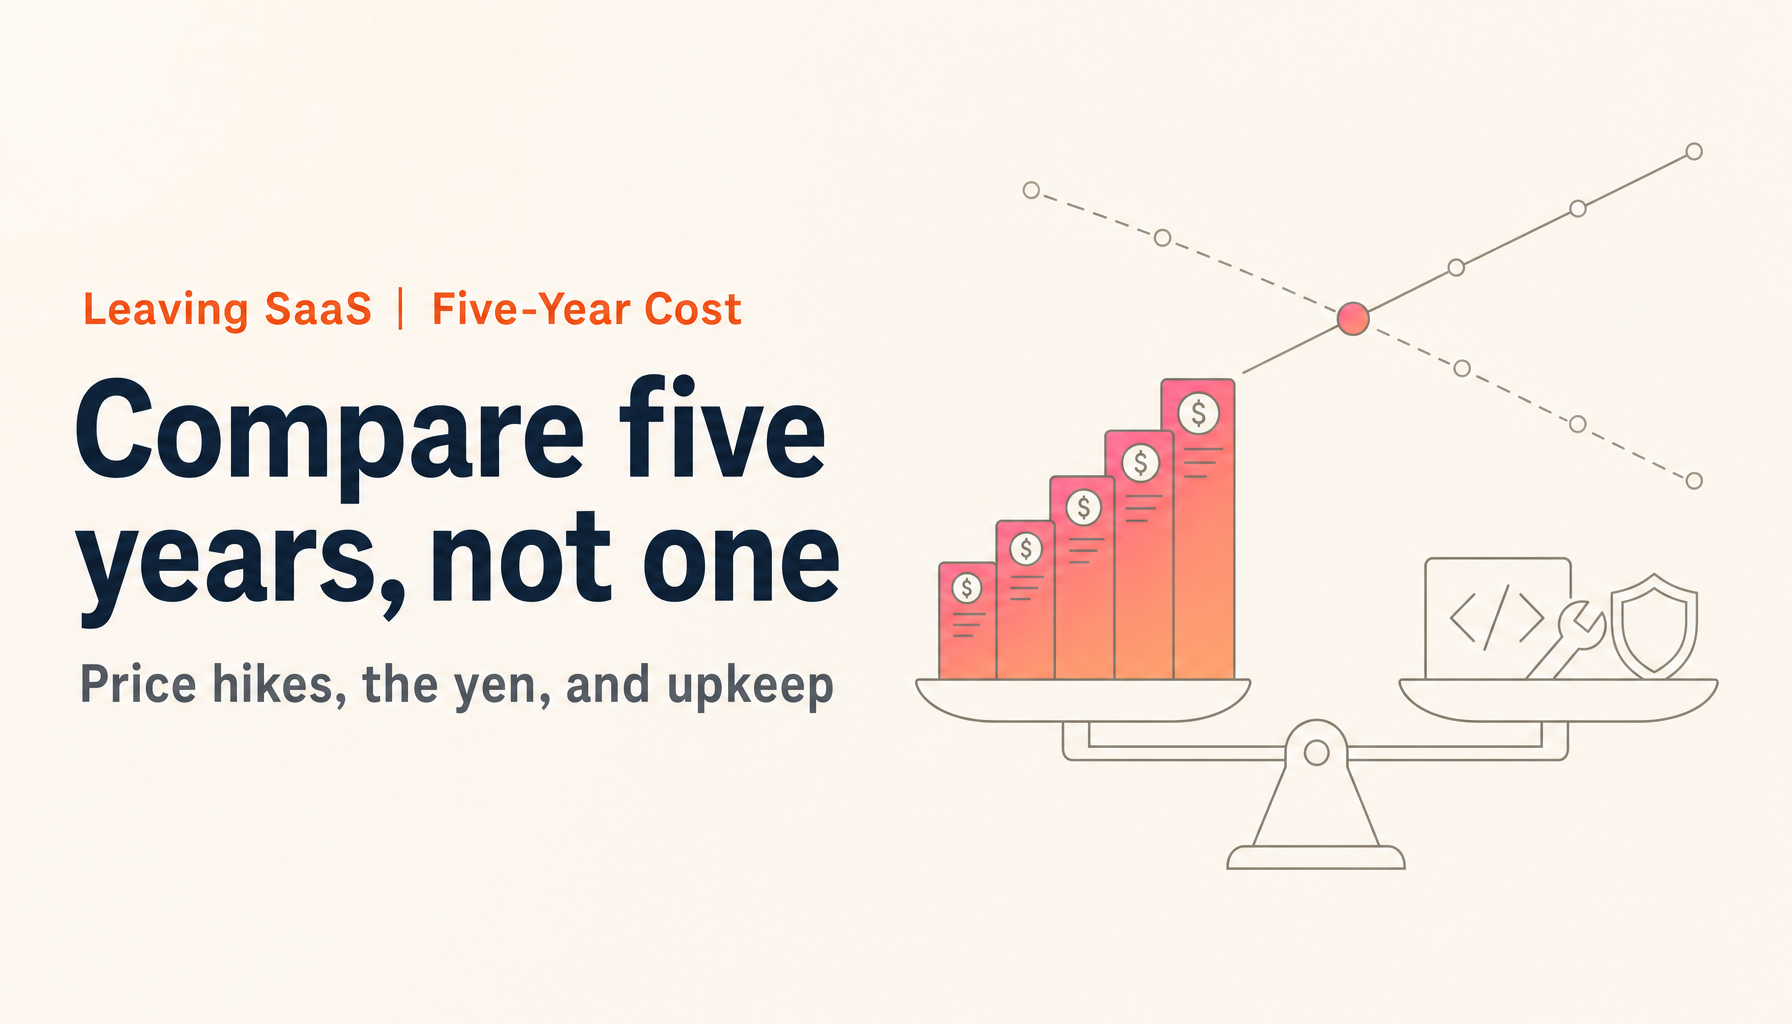
This is the third article in a five-part series on cancelling expensive SaaS and bringing systems in-house. The first article asked whether it is worth considering at all, and the second looked at which business systems are safe to build yourself. This one puts numbers on what a candidate costs over five years. I use three things: the actual record of price increases and the yen, a five-year total for a model case built on our own assumptions, and a table of the variables that move the break-even point. On the build side I always include maintenance, security, and people. A calculation without them is written to get approval, nothing more.
The figures are in yen because the model case is a Japanese company paying for a dollar-priced SaaS. If you pay in dollars, the currency section will matter less to you, but the structure of the comparison carries over.
SaaS bills rise two ways: dollar list prices and yen repricing
Overseas SaaS paid in yen gets more expensive through two channels. One is a change to the dollar list price. The other is a review of the yen price in light of the exchange rate. Japanese buyers take both.
A major global productivity-suite vendor shows how large the yen repricing can be. In April 2023 it raised the yen prices of its online services for businesses by 15 percent and its on-premises products by 20 percent. According to press coverage, the basic plan stayed at $6 a month while the yen price went from ¥650 to ¥750.1 In dollars, that increase doesn't exist. In April 2024 it raised prices for business software and cloud services by another 20 percent across the board, and said it may adjust local-currency prices as part of a pricing review held roughly twice a year, taking the dollar exchange rate into account.2 Then in July 2026 the dollar list prices themselves changed, with increases ranging from zero to 33 percent depending on the plan. The vendor attributed it to continued investment in AI features and the infrastructure behind them.3
It isn't just one vendor. A major CRM vendor raised prices on the upper editions of its main products by an average of 6 percent in August 2025, saying the increase reflected stronger AI capabilities.4 A major Japanese no-code platform changed its per-user monthly price in November 2024 from ¥780 to ¥1,000 on the light plan and from ¥1,500 to ¥1,800 on the standard plan, and raised the minimum contract from 5 to 10 users.5 Each vendor gave a reason, usually new features or investment in operations. I'm not calling these increases unfair. But whoever builds a five-year budget has to assume prices will go up.
Now the currency. I took the Bank of Japan's monthly averages for the dollar-yen spot rate in Tokyo and averaged them by year: ¥106.78 for 2020, ¥151.50 for 2024, and ¥158.78 for January through August 2026.6 That's a yen roughly 49 percent weaker than in 2020. For a SaaS priced at $60 per user per month, the monthly cost per user rose from ¥6,407 to ¥9,527 without the dollar price moving at all.
Corporate budgets show it. In the IT Trends Survey 2026 by the Japan Users Association of Information Systems (JUAS), the second most common reason for rising IT budgets was the weak yen, rising labor costs, and vendor price increases, cited by 46.6 percent of companies in their fiscal 2025 plans.7 This stopped being a problem for a handful of companies some time ago.
Putting the annual fee next to the development cost gives the wrong answer
The same JUAS survey found that the top expected benefit of bringing system development in-house was lower development cost, at 41.3 percent.7 Wanting to cut costs makes sense. The trouble is in how the comparison gets made.
"We pay ¥34.56 million a year for this SaaS. We can build it for ¥30 million. It pays for itself in a year." I see calculations like this all the time. They're easy to follow, and they mislead in three ways.
First, you keep paying for the SaaS while you build. Most SaaS contracts are annual and renew automatically unless you give notice some set period before the renewal date. If development takes eight months and migration plus parallel running takes another four, the whole first year of SaaS fees stays on the bill. The fourth article on cancellation and migration covers notice deadlines and data export. For the calculation, it's realistic to assume you pay for both in year one.
Second, costs continue after the build. In the same JUAS survey, fiscal 2025 IT budgets split 75.9 percent to maintaining and running current operations and 24.1 percent to new initiatives.7 Three quarters of corporate IT spending goes to keeping existing things running. A system you build moves into that three quarters the following year.
Third, the SaaS side has hidden costs too: administrators configuring settings, adding and removing users, maintaining integrations with other systems. A fair comparison puts internal effort on both sides.
Japanese government guidance takes the same view. The Digital Agency's DS-310, its basic policy on using cloud services in government information systems, strongly recommends SaaS but says the recommendation isn't unconditional. Where SaaS fees become expensive during operation, for instance as users are added in stages, it calls for a careful check on whether savings really materialize on a lifecycle-cost basis, and says that if the same functions can be built on other managed services, the two approaches should be compared properly. It also warns that per-account and high-priced SaaS can balloon as the account count grows.8 The calculation here is that comparison, reshaped for a private company's approval request.
One more thing to check before building: licenses nobody uses. A US SaaS management tool vendor reported in January 2026 that across the more than 40 million licenses it manages, an average of 36 percent went unused against recommended utilization levels.9 It's US-centric data drawn from the customers of a company that sells SaaS management tools, so don't apply it to your own company as is. Still, before deciding to build, it's worth looking at your own login records once.
Looking for AI training and consulting?
Learn about WARP training programs and consulting services in our materials.
A five-year total for a model case (300 users, $60 a month, ¥160 to the dollar)
From here on, the numbers rest on assumptions we set. They are not any real company's costs. Every figure is a placeholder meant to be replaced with your own.
The model is a Japanese company with 300 users on a business SaaS. The dollar list price is $60 per user per month, and the exchange rate is ¥160 to the dollar, rounded from the January to August 2026 average of ¥158.78. The dollar list price rises 3 percent a year. I set that below the increases mentioned above (6 percent on average, up to 33 percent) because I didn't want a calculation that flatters the build side. On the build side, the company rebuilds only the features it actually uses and cancels the SaaS at the renewal date at the end of year one.
| Cost item | Keep the SaaS | Build in-house |
|---|---|---|
| License fees | 300 users × $60 × ¥160 = ¥34.56M in year one, rising 3% a year in dollars | Paid until the renewal date in year one (¥34.56M) |
| Internal admin effort | ¥1M a year | ¥1M in year one only, while the SaaS is still in use |
| Initial development | None | ¥30M (20 person-months × ¥1.5M) |
| Data migration and testing | None | ¥4M |
| Internal cost of parallel running | None | ¥3M (60 key users × 20 business days × 30 minutes a day × ¥5,000 an hour) |
| Security | None | ¥1.5M pre-launch assessment; from year two, ¥2M a year for assessment, monitoring, and vulnerability fixes |
| Cloud | None | $15,000 a year (¥2.4M at ¥160); ¥1.2M for half a year in year one |
| Maintenance and changes | None | From year two, 25% of initial development cost (¥7.5M a year) |
| Internal owner | None | Half a person's fully loaded cost, ¥5M a year from year one |
Laid out over five years, in millions of yen and rounded, it looks like this.
| Year | Keep the SaaS | Build in-house | Cumulative gap (keep − build) |
|---|---|---|---|
| Year 1 | 35.56 | 80.26 | −44.70 |
| Year 2 | 36.60 | 16.90 | −25.00 |
| Year 3 | 37.66 | 16.90 | −4.24 |
| Year 4 | 38.76 | 16.90 | +17.62 |
| Year 5 | 39.90 | 16.90 | +40.62 |
| Five-year total | 188.48 | 147.86 | +40.62 |
Keeping the SaaS costs about ¥188.5 million over five years. Building costs about ¥147.9 million. The gap, ¥40.6 million or roughly $254,000 at ¥160, favors building. But the build side only catches up on a cumulative basis in year four. At the end of year three it is still ¥4.24 million behind, and in year one, when you pay for both the SaaS and the development, it is ¥44.7 million heavier. This is where people are tempted to write "payback in three years." Under these assumptions, you can't.
I deliberately left some costs out, mainly a major rebuild or platform replacement partway through. If conditions held from year six on, the gap would widen by about ¥24 million a year. By then the odds of a rebuild are climbing, though, so I recommend cutting the approval calculation off at five years.
Why maintenance, security, and people belong on the build side
I set build-side maintenance at 25 percent of initial development cost a year, which is on the heavy side, for a reason. Several studies suggest that while generative AI speeds up writing code, the work of fixing and securing it may actually grow.
In a randomized controlled trial METR published in July 2025, 16 experienced open-source developers worked on 246 real issues and took 19 percent longer when allowed to use AI. Beforehand they expected a 24 percent speedup, and afterward they still believed AI had sped them up by 20 percent.10 In a February 2026 update, METR reported that with late-2025 AI tools the change in completion time was −18 percent, with a confidence interval from −38 to +9 percent. The authors think a speedup is likely, but say selection effects, such as developers declining to take part because they don't want to work without AI, make the true effect hard to see.11 You can't say AI isn't making developers faster. You also can't say the number is solid enough to cut an estimate in half.
The 2025 report from DORA, a research program on software delivery, drew on nearly 5,000 responses and found that AI adoption has a positive relationship with delivery throughput but still a negative one with delivery stability. Ninety percent of respondents use AI at work and more than 80 percent believe it has made them more productive, yet 30 percent report little or no trust in AI-generated code.12 GitClear, a developer analytics company, analyzed 211 million changed lines and found that the share of "moved" lines, the signature of refactoring, fell from 24.8 percent in 2021 to 9.5 percent in 2024. Copy-pasted lines went the other way, from 8.4 to 12.3 percent. The share of lines rewritten soon after being written rose from 3.3 to 5.7 percent.13 The plain reading is that the cost of fixing what you build hasn't fallen as fast as the cost of building it.
Security tells the same story. Veracode, a security product company, had more than 100 language models write code, and 45 percent of the samples failed security tests. Newer and larger models were no better at writing secure code.14 It's a vendor's study, so discount it accordingly. It still isn't a reason to leave pre-launch assessment and ongoing monitoring and patching out of the budget.
Then there are people. In DX Trends 2025 from the Information-technology Promotion Agency, Japan (IPA), 334 Japanese companies bringing development in-house were asked about their challenges. Difficulty hiring or developing the right people stood out at 82.3 percent, and 15.0 percent said cost awareness drops compared with outsourcing.15 A system you build needs someone inside the company who takes requests, sets priorities, and decides what gets fixed. That's why I put half a person's cost in from year one. Remove that line and the calculation gets ¥5 million a year easier on the build side.
Parallel running is another line that's easy to forget. IPA's guide to successful system rebuilds warns that running the old and new systems side by side increases the burden on user departments, and that you need to confirm how much of it they can absorb.16 The ¥3 million in the table assumes 60 key users entering data twice for 30 minutes a day over one month. Double the people or the period and this line doubles too.
The variables that move the break-even
The model's conclusion can flip when a single assumption changes. The next table moves one variable at a time and holds the rest at the baseline. The five-year gap is the keep-the-SaaS total minus the build total, so a positive number means building is cheaper.
| Variable changed | Value | Five-year gap | Year the cumulative lines cross |
|---|---|---|---|
| Baseline | 300 users, $60 a month, ¥160 per dollar, 3% annual increase | +¥40.62M | Year 4 |
| Exchange rate | ¥140 per dollar | +¥23.36M | Year 4 |
| Exchange rate | ¥180 per dollar | +¥57.89M | Year 3 |
| Dollar price increase | 0% a year | +¥29.94M | Year 4 |
| Dollar price increase | 10% a year | +¥68.13M | Year 3 |
| Users | 150 | −¥33.84M | Not within five years |
| Users | 240 (licenses cut by 20%) | +¥10.84M | Year 5 |
| Users | 450 | +¥115.09M | Year 3 |
| SaaS unit price | $40 a month | −¥9.02M | Not within five years |
| Initial development | ¥15M (came in at half) | +¥70.62M | Year 3 |
| Initial development | ¥45M (1.5x overrun) | +¥10.62M | Year 5 |
| Maintenance and changes | 40% of development cost a year | +¥22.62M | Year 4 |
| Both overrun at once | ¥45M and 40% a year | −¥16.38M | Not within five years |
The biggest lever is the number of users and the SaaS unit price, in other words the size of the annual SaaS bill. At 150 users, or at $40 a month, the build side never catches up within five years under these conditions. A small SaaS bill doesn't pay back a rebuild. Obvious, maybe, but it's the check that gets skipped most often in approval meetings.
Currency and price increases matter too. A ¥10 move in the exchange rate shifted the five-year gap by about ¥8.6 million. The build side feels a weak yen as well, since it pays for cloud in dollars, just less than the SaaS side does. Still, whether prices rose 0 or 10 percent a year, building won within five years at the baseline. Currency and price increases shift the crossover by about a year. What flips the conclusion is users, unit price, and how reliable the build estimate is.
That reliability is the second-biggest lever. If development runs 1.5 times over and maintenance costs 40 percent a year, building loses by ¥16.38 million even at the baseline. Neither is an unusual miss in system development. If development comes in at half, the gap widens to ¥70.62 million. My view is that the number in an approval request should be a range like this table, not a single figure. Show a base case, an optimistic case, and a pessimistic case, and let management decide whether they can live with the pessimistic one.
One more row is worth a look: 240 users, after cutting licenses by 20 percent. Building's five-year advantage shrinks to ¥10.84 million and the crossover slips to year five. A license cleanup alone can change the decision. One caution, though. Some major SaaS master agreements contain a clause that re-prices a renewal when you reduce volume, regardless of the previous unit price. You can cut seats expecting to save and find the unit price has gone up, so read the contract first. I'll come back to this in the fourth article.
It's also safer to write an exit condition into the approval request. Something like: "If development spending passes 60 percent of budget by month four, renew the SaaS and stop building." The SaaS renewal date becomes your decision date. Once you treat build versus buy as a call you can revisit at every renewal rather than a one-time bet, the approval request gets a little lighter.
How this differs from contract development
If you carry this out with an outside partner, the table looks different depending on whether you hire a contract developer or work with an FDE (Forward Deployed Engineer, an engineer who works on site with the customer and builds software that runs).
In contract development, hours are revenue. The initial development line and the maintenance line from year two both stay on the books for five years as payments to the vendor. Because the job is to build what the specification says, features that turn out to be unnecessary usually get built anyway. From the buyer's side, the two most uncertain lines in the table, development cost and maintenance rate, end up resting on the vendor's hour estimates.
At TIMEWELL we treat FDE hours as investment, not revenue. We show a working prototype on day one and build while checking which features are actually used, so unused features don't get built. Common mechanisms that other companies can use go back into our product, and steps unique to your company stay as your configuration. The engagement ends when your own staff can maintain the system themselves. In the table's terms, the aim is a smaller development line and a maintenance line sized for your team to carry. I wrote about how the contract is structured in the article on measuring outcomes and contracting.
What our FDE service can do
Our FDE service starts by building this article's calculation with your real numbers. We check the renewal date and notice deadline in your contract, the license count against actual login records, and which features are used and which aren't, then replace each placeholder in the table with a real figure.
We don't set the most uncertain number, development cost, from a desk estimate alone. We build a prototype on your real data with personal information and other sensitive fields masked, confirm how much actually needs rebuilding, and only then put a number on it. With a prototype in hand, facts like "nobody really uses this screen" or "we can't lose this one report" surface early, and the range on development cost narrows. It shrinks the second-biggest lever in the sensitivity table before you commit.
What we build runs in your own cloud environment by default, designed so the region and other settings can be chosen to fit your requirements. The fifth article covers permissions and data location when apps run in your own tenant. We also plan the migration and parallel run with you, working back from the SaaS renewal date.
Our practice and its limits
There are a few things I want to say plainly.
First, if the calculation says keep the SaaS, we'll tell you so. Few users, a low unit price, or complex work bound by law and accounting rules, such as accounting or payroll: under those conditions you're better off keeping the SaaS and spending your time on license cleanup and renewal negotiations. The second article covers which systems are reasonable to rebuild.
Second, the 25 percent maintenance rate and the security costs here don't come from our own five-year track record. We don't yet have five years of operating data for business apps we've built as an FDE. That's why the table is labeled as assumptions and every premise is laid out, so you can recalculate with your own numbers.
Third, we are on the build side of this business, and I know that puts us in a position that leans toward "build." That's exactly why I kept the SaaS price increases conservative and loaded maintenance, security, and people onto the build side generously. If a line still looks too kind, make it harsher and run the numbers again. If the conclusion changes, that's your company's answer.
Last, we're a small company and can only be at so many sites at once. The closer your SaaS renewal date, the more it helps to reach out early, so there's time for both the prototype and the calculation.
Summary
- SaaS bills rise through two channels: dollar list-price increases and yen repricing. The yearly average dollar-yen rate moved from ¥106.78 in 2020 to ¥158.78 for January through August 2026 (our calculation from Bank of Japan monthly averages).
- Compare five-year totals, not the annual fee against the development cost. On the build side, include SaaS fees until cancellation, migration, parallel running, maintenance and changes, security, cloud, and an internal owner.
- In our assumed model case of a Japanese company (300 users, $60 a month, ¥160 to the dollar), building came out ¥40.62 million cheaper over five years, and the cumulative lines crossed in year four.
- What flips the result is users, unit price, and the reliability of the build estimate. Currency and price increases moved the crossover by about a year.
- Put a range and an exit condition in the approval request, and use the SaaS renewal date as the decision date.
Build or keep isn't a question of which is right. It's a question of which assumption, once it breaks, flips the answer. Replace each line of the table with your own numbers and you'll see where the real argument is.
If you want to run a five-year total on your own SaaS, or narrow the development-cost range with a prototype first, take a look at our FDE service or book an FDE consultation. The fourth article in the series covers cancellation notice deadlines, data export, and planning the parallel run.
Footnotes
-
Report on the yen price revision for business licenses (@IT, April 7, 2023). In Japanese. The unchanged dollar price is also from this report ↩
-
Report on the 20 percent increase for business software and cloud services (Nikkei xTECH, December 8, 2023). In Japanese. The roughly twice-yearly pricing review is also from this report ↩
-
Report on the subscription price revision from July 2026, up to 33 percent (ITmedia Enterprise, December 19, 2025). In Japanese ↩
-
Report on the average 6 percent increase for major editions (ITmedia NEWS, June 18, 2025). In Japanese ↩
-
Report on a Japanese no-code platform's price revision and new minimum user count (Weekly ASCII, June 1, 2024). In Japanese ↩
-
Bank of Japan Time-Series Data Search. Series FXERM07, Tokyo market dollar-yen spot rate at 17:00, monthly average. Annual figures are our simple averages of the monthly values; 2026 covers January to August. Retrieved September 29, 2026 ↩
-
IT Trends Survey Report 2026 (Japan Users Association of Information Systems, April 2026). In Japanese. Reasons for rising IT budgets: Figure 2-1-3 in section 2.1; budget allocation: section 2.1 (4); expected benefits of insourcing: Figure 7-2-6 in section 7.2 ↩ ↩2 ↩3
-
DS-310 Basic Policy on the Appropriate Use of Cloud Services in Government Information Systems (Digital Agency, May 27, 2025). In Japanese ↩
-
Annual survey published January 29, 2026 by a US SaaS management tool vendor, covering more than 40 million licenses and $75 billion in spend under its management. By our policy, we do not name or link the company ↩
-
Measuring the Impact of Early-2025 AI on Experienced Open-Source Developer Productivity (METR, July 10, 2025) ↩
-
We are Changing our Developer Productivity Experiment Design (METR, February 24, 2026) ↩
-
State of AI-assisted Software Development 2025 (DORA, September 2025) ↩
-
AI Copilot Code Quality 2025 (GitClear, February 2025). A study by a developer analytics company. Figures are from the table "Trends in Code Changes: 2020-2024" ↩
-
2025 GenAI Code Security Report (Veracode, July 30, 2025). A study by a security product company ↩
-
DX Trends 2025 (Information-technology Promotion Agency, Japan, June 2025). In Japanese. Figure 2-16 (companies bringing development in-house, n=334) ↩
-
User Guide to Successful System Rebuilding, 2nd edition (Information-technology Promotion Agency, Japan, February 2018). In Japanese. Table 3.9, examples of risk countermeasures ↩