Hello, this is Ryuta Hamamoto from TIMEWELL.
A headline saying Japan has been overtaken is usually worth reading twice. Once for the fact. Once for how the fact was measured.
On 7 August 2026 it was reported that Korea and Taiwan had both passed Japan in export value for the first time. Taken alone the numbers are striking. But once you line up what each country's own statistical agency published, the story has at least two layers: how much of the AI boom each export structure can physically absorb, and which currency you happen to be measuring in.
Rather than repeating the headline figures, I went to the primary releases from Korea's Ministry of Trade, Industry and Energy, Taiwan's Ministry of Finance, and Japan's Ministry of Finance. There is a practical angle too: more exports means more classification and screening. If you want to know whether your own setup can absorb that increase, the free export control and economic security self-check is a good starting point.
First, the three numbers side by side
Here is what each agency published.
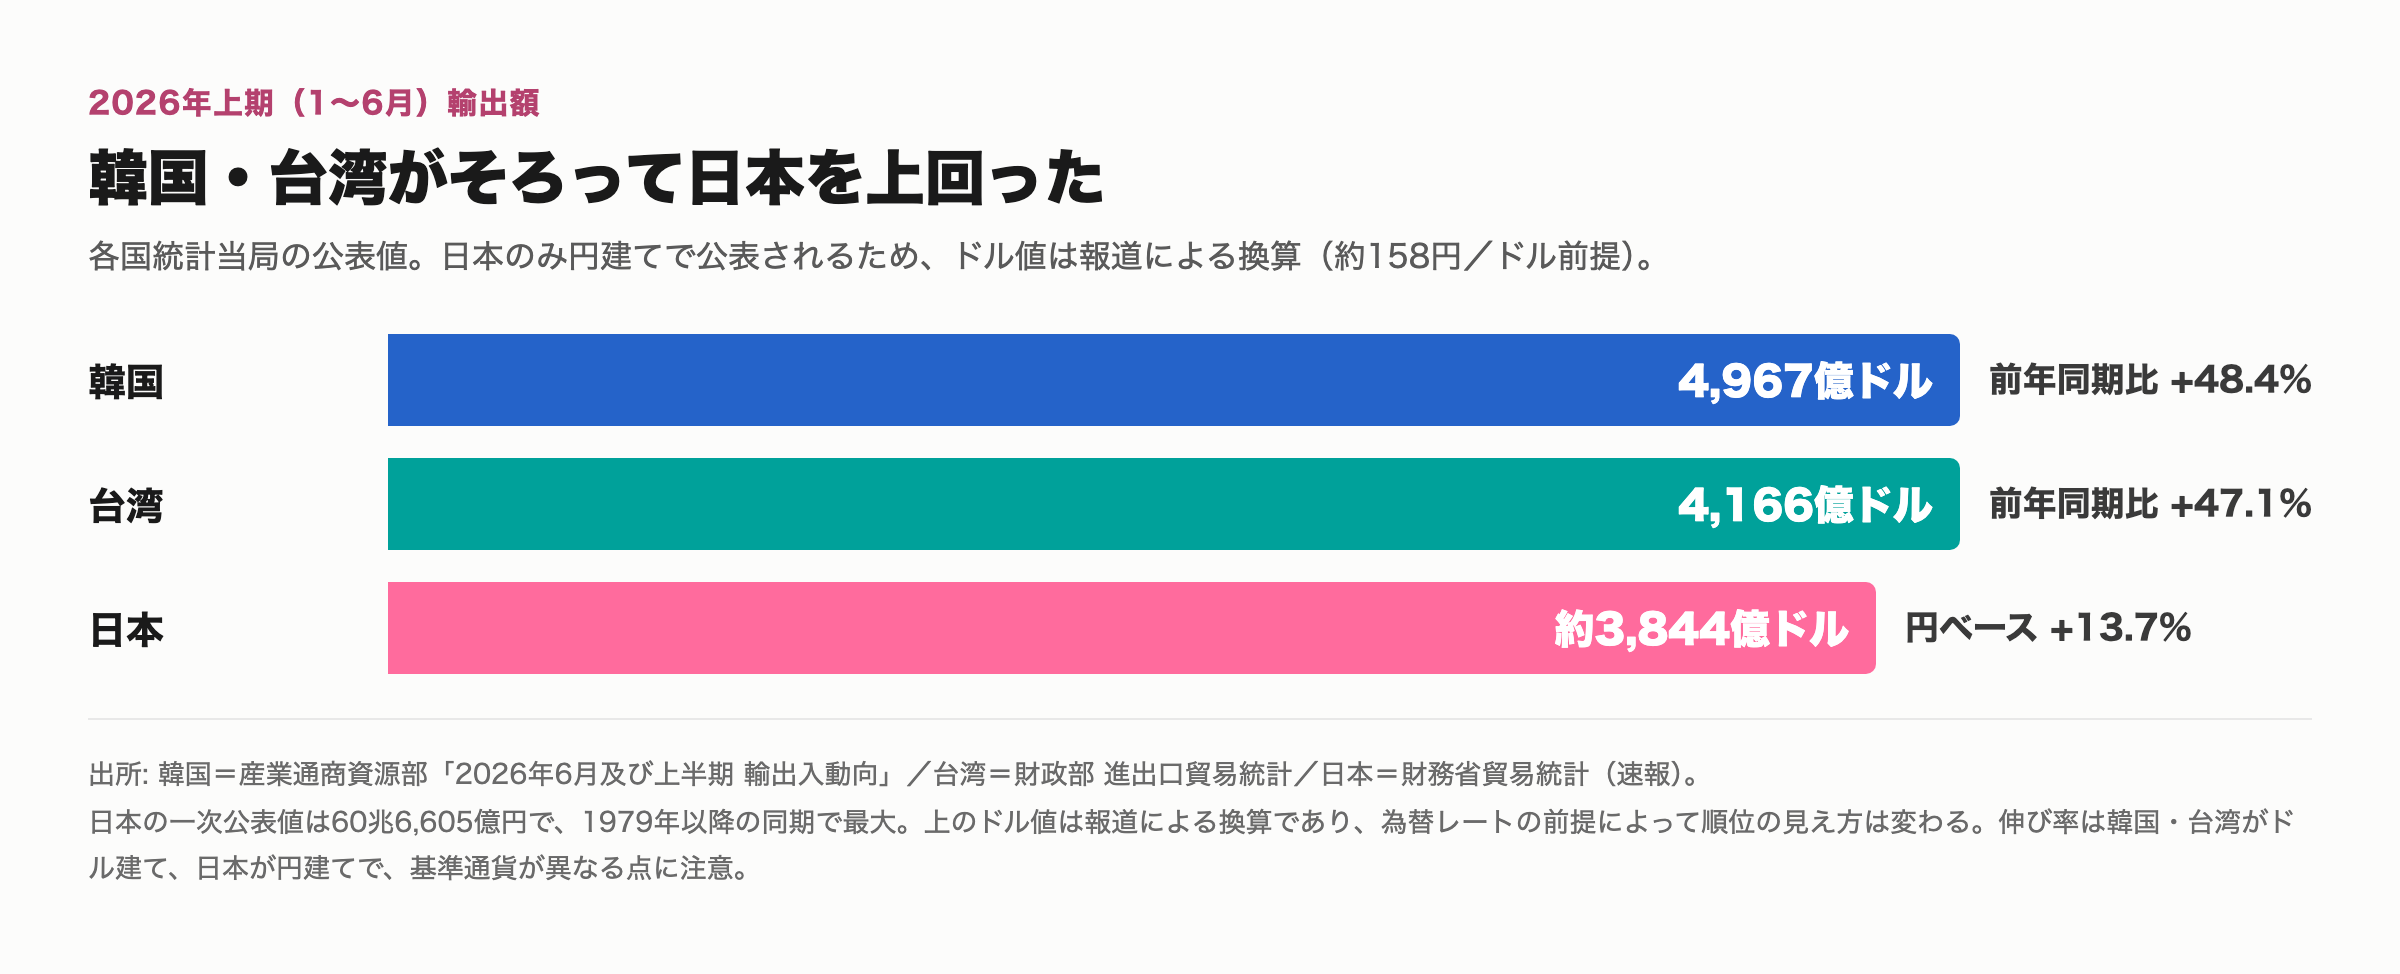
Korea's H1 2026 exports came to USD 496.7 billion, up 48.4% year on year1. Semiconductors alone accounted for USD 192.4 billion, up 162.6%, which in six months exceeded the previous full-year record. June alone reached USD 102.3 billion, the first month ever above USD 100 billion. Imports were USD 358.4 billion, up 16.6%, leaving a trade surplus of USD 138.3 billion.
Taiwan recorded USD 416.6 billion, up 47.1%2. That is a record for any first half, and the second-highest growth rate on record. The second quarter alone came to USD 220.9 billion, the first quarter ever above USD 200 billion. June was USD 74.8 billion, up 40.3%.
Japan's figure, from MOF Trade Statistics (preliminary), was JPY 60.6605 trillion, up 13.7%3. This is the part that matters: that is the highest for any comparable first half since 1979. Japanese exports did not fall. They set a record.
The ranking flipped anyway, partly because Korea and Taiwan grew close to 50%, and partly because the comparison is being run in dollars.
"Record high" and "third place" are both true
Take Japan's export figure on its own and look at it in two currencies.
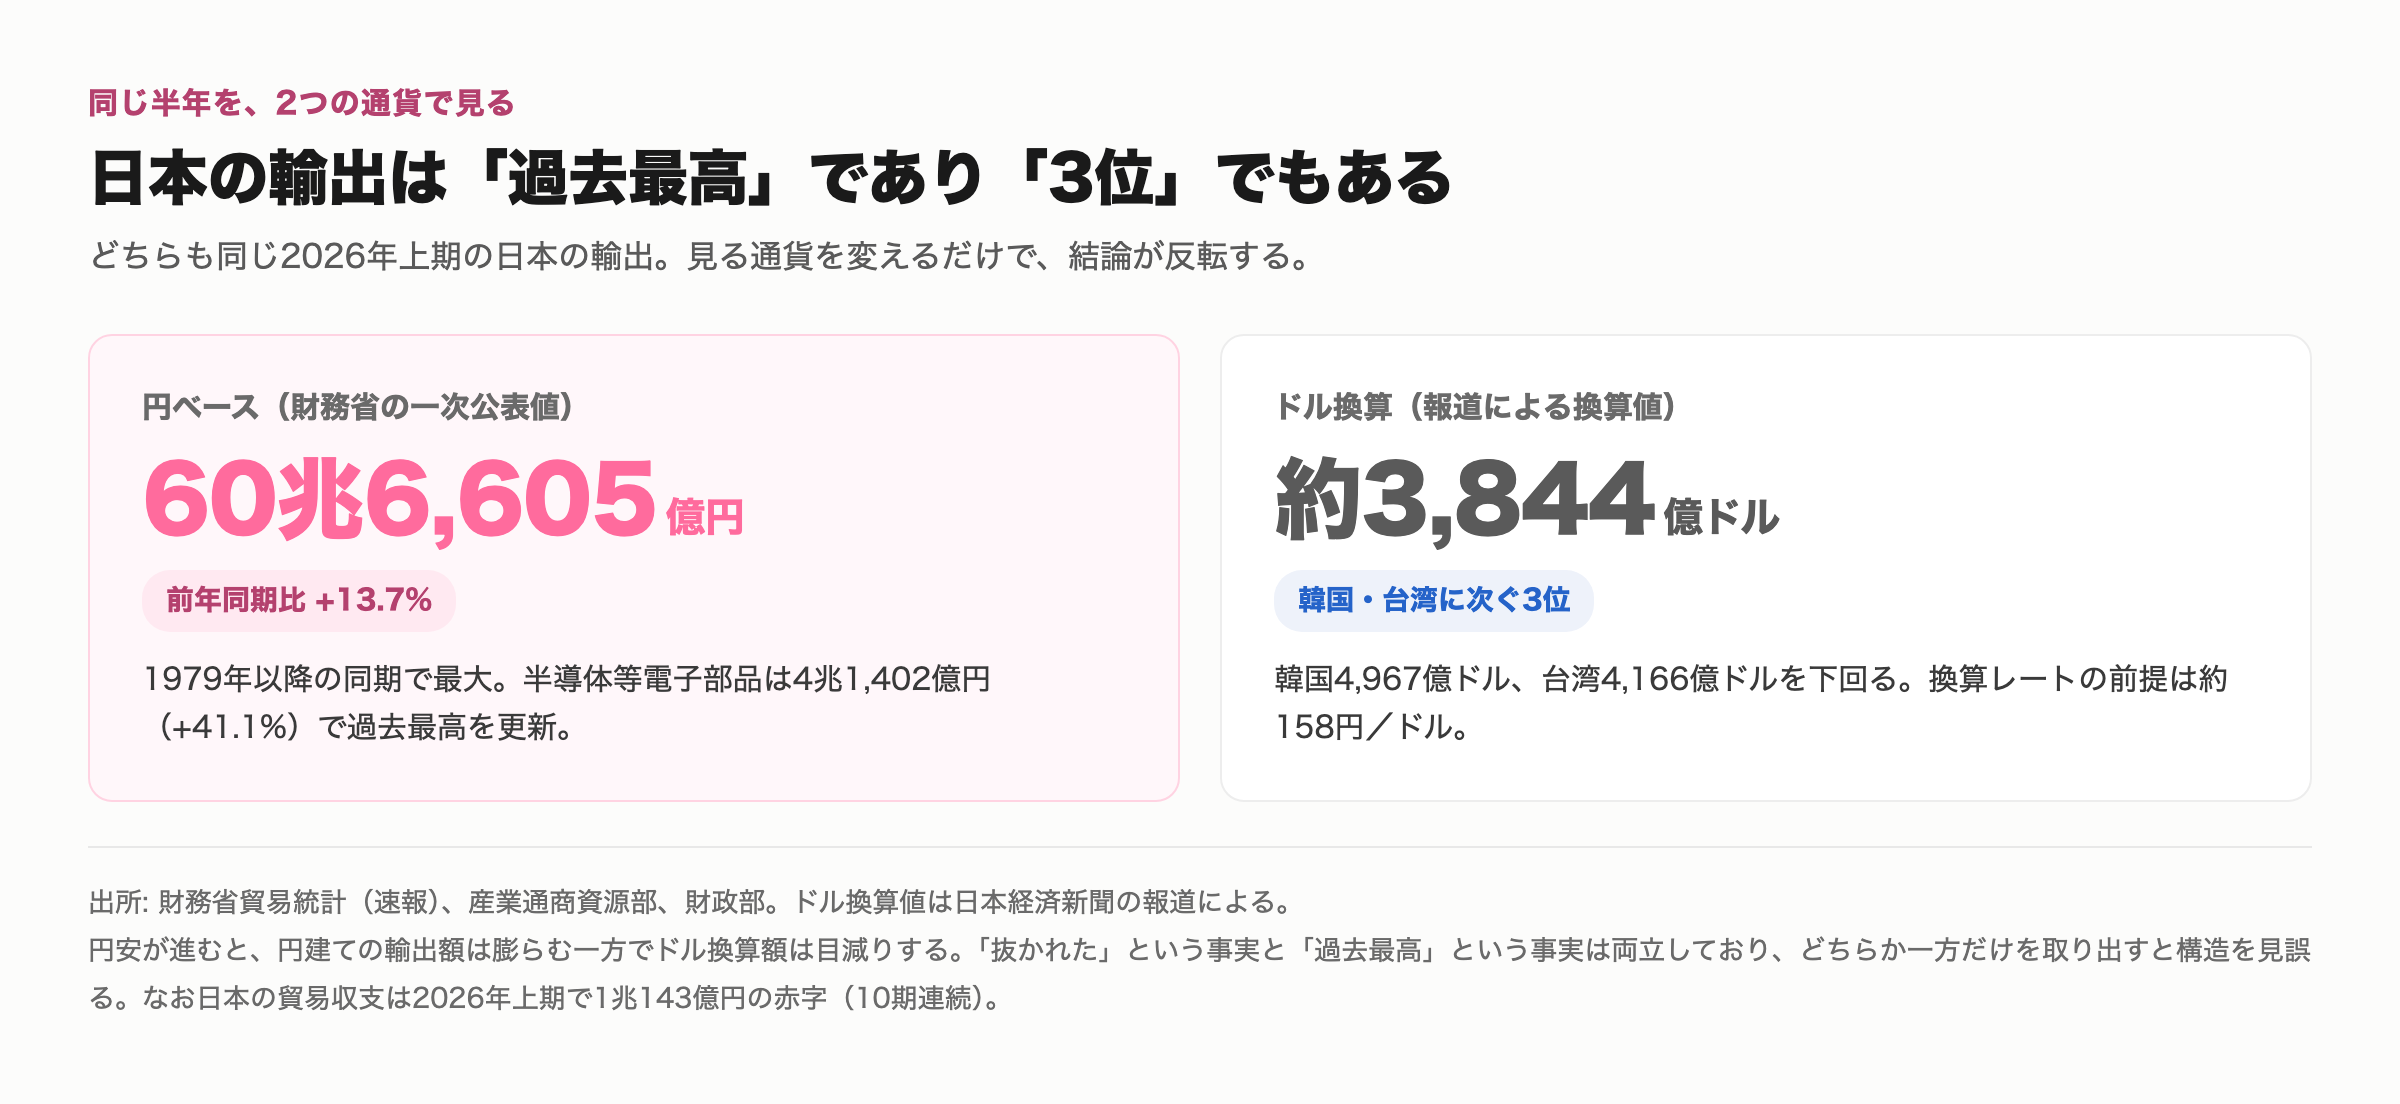
Same six months, same exports. In yen it is the largest since 1979; in dollars it is third. The roughly USD 384.4 billion figure in circulation assumes about 158 yen to the dollar.
This is not a statistical trick. A weaker yen inflates the yen-denominated total while shrinking the dollar conversion. So "record high" and "overtaken" sit together without contradiction. Pull out either one on its own and you will misread the structure.
What concerns me is how easily that duality drops out of the conversation. Told that Japan lost to Korea in exports, most people picture volumes falling. What actually happened is that Japanese exports set a record while two neighbours grew faster still. That should change how the urgency is framed.
The numbers also show that a weak yen is not a cure-all. Japan's H1 2026 trade balance was a deficit of JPY 1.0143 trillion, the tenth consecutive period in deficit3. Record exports, and imports still growing faster. A weak yen inflates export receipts and import costs alike.
Replace siloed classification work with AI.
METI's FY2024 data shows 52% of foreign exchange law violations stem from classification errors. Download the TRAFEED product catalog covering features and rollout.
The real gap is structural
So where does the growth differential come from? Industrial structure.
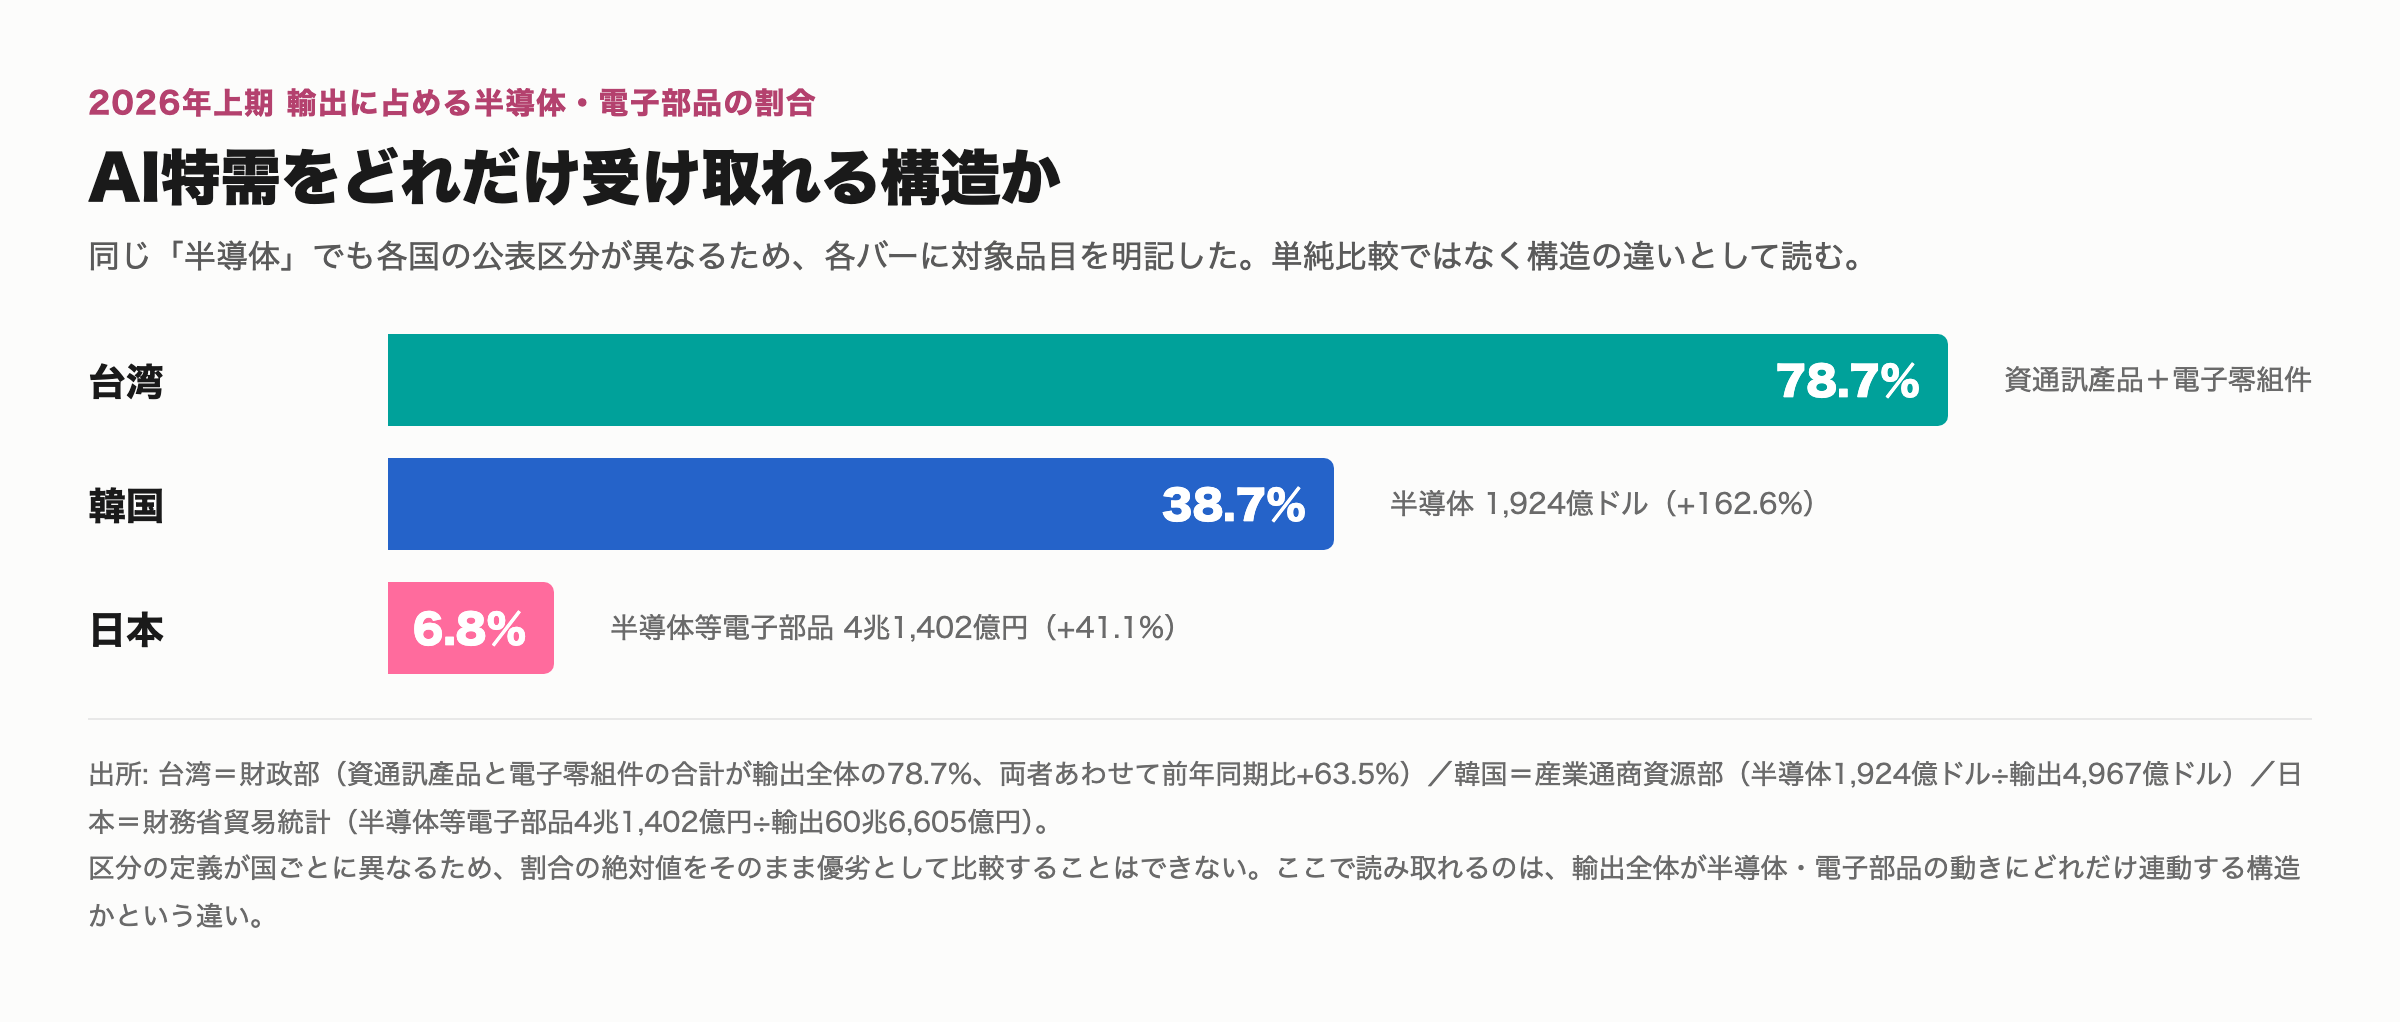
In Taiwan, information and communication products plus electronic components together made up 78.7% of all exports, and those two categories alone grew 63.5% year on year2. In Korea, semiconductors at USD 192.4 billion represent about 38.7% of total exports1. Japan's semiconductors and electronic parts came to JPY 4.1402 trillion, about 6.8% of the total3.
A quick caveat before anyone runs with those percentages. The published categories are not defined identically. Taiwan's "ICT products plus electronic components" is a broader bucket than Japan's "semiconductors and electronic parts," so the absolute shares cannot be read as a ranking. What they do show is real: how tightly each country's total exports track semiconductors and electronic components differs completely across the three.
Taiwan's exports rise as a whole when AI demand arrives, and that is exactly what happened. Nearly 40% of Korea's move with it too. Japan's tracks at around 7%, with the rest spread across autos, machinery, chemicals and materials. In a single-demand explosion like this one, concentration wins decisively. The flip side is that when demand recedes, concentration takes the harder hit.
Which is why I would not read this as a defeat for Japan's industrial structure. Diversification hurts in a boom and helps through a cycle. The honest verdict needs at least one full cycle.
Where Japan still leads
One fact gets overlooked. Japan's semiconductor and electronic parts exports themselves set a record at JPY 4.1402 trillion, up 41.1%3. The small share of the total reflects how large the other categories are, not stagnation in semiconductors.
In equipment and materials, Japan is reported to have held a substantial position through this cycle, with the largest semiconductor manufacturing equipment exports of the three in H1 20264. Countries that build and sell AI chips and countries that sell the tools and materials to build them should look different in trade statistics. The former books the full value of a finished product; the latter books along the capex cycle.
That distinction matters for economic security, because equipment and materials sit upstream of downstream capacity, which is precisely why they attract export control attention. For the regulatory picture, see semiconductor export control between Japan and the US.
How to think about what comes next
I cannot forecast, but the published figures support some arithmetic. What follows is a mechanical projection with stated assumptions, not an official outlook.
Taiwan's H1 was USD 416.6 billion, with USD 220.9 billion in Q2 alone. If the second half merely holds the Q2 pace, the full year lands around USD 850 billion. Taiwan's Ministry of Finance has indicated its trade surplus with the US may exceed USD 200 billion for the year2. Korea crossed USD 100 billion in a single month for the first time in June; sustaining that would put a USD 1 trillion year within sight.
All of that assumes AI-driven demand continues at the current pace. Semiconductor demand has historically been cyclical. Projections built on peak growth rates miss badly in both directions. If you circulate these numbers internally, carry the assumption with them.
For Japan, even continued growth in yen terms can push the dollar ranking down further if the yen strengthens, and the reverse holds too. A ranking that moves with the exchange rate is not a measure of industrial competitiveness. Worth repeating.
What this means for export control work
To bring it back to our own field.
More export value means, directly, more classification and screening. And the growth is concentrated in semiconductors and electronic components, exactly the categories that catch on both list controls and catch-all controls. Japan's semiconductors and electronic parts growing 41.1% implies a proportionally wider base of items requiring determination.
There is a second effect. Surging exports from two neighbouring economies means Japanese companies gain more touchpoints as customers and resellers. Your product goes to a Taiwanese or Korean firm, is integrated there, and leaves for a third country. The thicker that path, the harder it becomes to trace who the ultimate end user is. Understanding a counterparty's ownership structure starts to matter more than it used to.
TRAFEED is our export control AI agent built to absorb that repetitive work. Aligned with METI standards, it supports classification and counterparty screening in a single flow. In a joint proof-of-concept with Okayama University using roughly 30,000 past review records, we confirmed AI judgment accuracy of 95% or higher. The final determination stays with your export control officer; what gets lighter is everything leading up to it.
If you want to rebuild the mapping of supply chain and technology at management level, the Economic Security Management Guidelines METI published in January 2026 are a reasonable starting point. Their very first principle is mapping your own value chain accurately.
Wrapping up
The essentials:
- H1 2026 exports: Korea USD 496.7bn (+48.4%), Taiwan USD 416.6bn (+47.1%), Japan JPY 60.6605tn (+13.7%). On a dollar basis, Korea and Taiwan both passed Japan for the first time
- Japanese exports did not fall. In yen they are the highest for any comparable first half since 1979. The ranking flipped from a combination of neighbouring growth and a weak yen shrinking the dollar conversion
- The real gap is structural. Semiconductors and electronic components are 78.7% of Taiwan's exports, 38.7% of Korea's, and 6.8% of Japan's. The three track AI demand very differently
- Japan's own semiconductor and electronic parts exports set a record, and Japan is reported to lead in semiconductor manufacturing equipment
- Full-year projections assume AI demand holds its current pace. Semiconductor demand has been cyclical; keep the assumption attached to the number
The headline is about rankings, but what I took from these figures was a lesson about measurement. Yen or dollars. By category or in total. The same six months wears a different face depending on the cut. When you are trying to create urgency internally, say which cut you used.
For practitioners, though, the count matters more than the rank. More exports means more determinations. This is a good moment to check whether your current setup can absorb the increase. If you want to talk it through, reach out via TRAFEED's individual consultation.
References
This article reflects published statistics as of 8 August 2026. National trade statistics are preliminary and subject to later revision. Full-year projections are mechanical calculations with stated assumptions, not official outlooks.
Footnotes
-
Republic of Korea, Ministry of Trade, Industry and Energy, "Export and Import Trends for June and the First Half of 2026" (published 1 July 2026). H1 exports USD 496.7bn (+48.4%), semiconductors USD 192.4bn (+162.6%), June alone USD 102.3bn, imports USD 358.4bn (+16.6%), trade surplus USD 138.3bn. https://www.motie.go.kr ↩ ↩2
-
Republic of China (Taiwan), Ministry of Finance, Department of Statistics, "Import and Export Trade Statistics" (published 9 July 2026). H1 exports USD 416.6bn (+47.1%, a record for the period), Q2 USD 220.9bn (+43.7%), June USD 74.8bn (+40.3%), ICT products plus electronic components 78.7% of total exports (+63.5% combined), H1 trade surplus with the US USD 104bn. https://www.mof.gov.tw ↩ ↩2 ↩3
-
Japan, MOF Trade Statistics (preliminary), first half of 2026. Exports JPY 60.6605tn (+13.7%, highest for any comparable first half since 1979), semiconductors and electronic parts JPY 4.1402tn (+41.1%, a record), trade balance a deficit of JPY 1.0143tn (tenth consecutive period). https://www.customs.go.jp/toukei/ ↩ ↩2 ↩3 ↩4
-
Nikkei, "Korea and Taiwan both pass Japan in exports for the first time: H1 2026, AI boom drives the gap" (7 August 2026). Japan's dollar conversion (approximately USD 384.4bn) and the country comparison of semiconductor manufacturing equipment are from this reporting. https://www.nikkei.com/article/DGXZQOUA050VT0V00C26A8000000/ ↩