Business Model Canvas Worksheet (editable PPT)
A fill-in Business Model Canvas that visualizes your whole business, cost structure, and revenue flows across nine blocks.
Download the PPT (free)PowerPoint (.pptx) ・ no email required
Hello, this is Ryuta Hamamoto from TIMEWELL.
I have seen it happen more than once: someone talks me through a great idea, eyes shining, and half a year later they are quietly winding the business down. The idea itself was not bad. What was missing was the overall design, how the idea would earn money from whom, what it would take to support that, and how much it would cost. An idea is only one part of a business model. A business stands up only when the way you earn and the machinery behind it come together.
The Business Model Canvas (BMC) is what lets you draw that whole picture on a single sheet of paper and take it all in at a glance. This article is the fifth in a series that walks step by step through how to build a new business. The overall map is laid out in the complete guide to new-business frameworks, so it reads more easily if you get a feel for the flow first. This time, we will work through, hands on and with a fictional new business, how to fill in the nine blocks and in what order, and how to design revenue and costs. If you want to first gauge whether your own business still has room to use AI, try the AI literacy check before reading on, and the way of using AI introduced in the second half of this article will click into place.
The Business Model Canvas is a shared language that translates a business onto one page
The BMC is a framework systematized by Alexander Osterwalder and Yves Pigneur in their 2010 book Business Model Generation. Its origins lie in Osterwalder's 2004 doctoral thesis, and it was first proposed around 2005. Ever since, it has been used around the world as a shared language for making the mechanics of a business visible, sharing them across a team, and testing them. It helps to think of it as a tool for translating the business concept in your head into a single diagram that others can look at and understand.
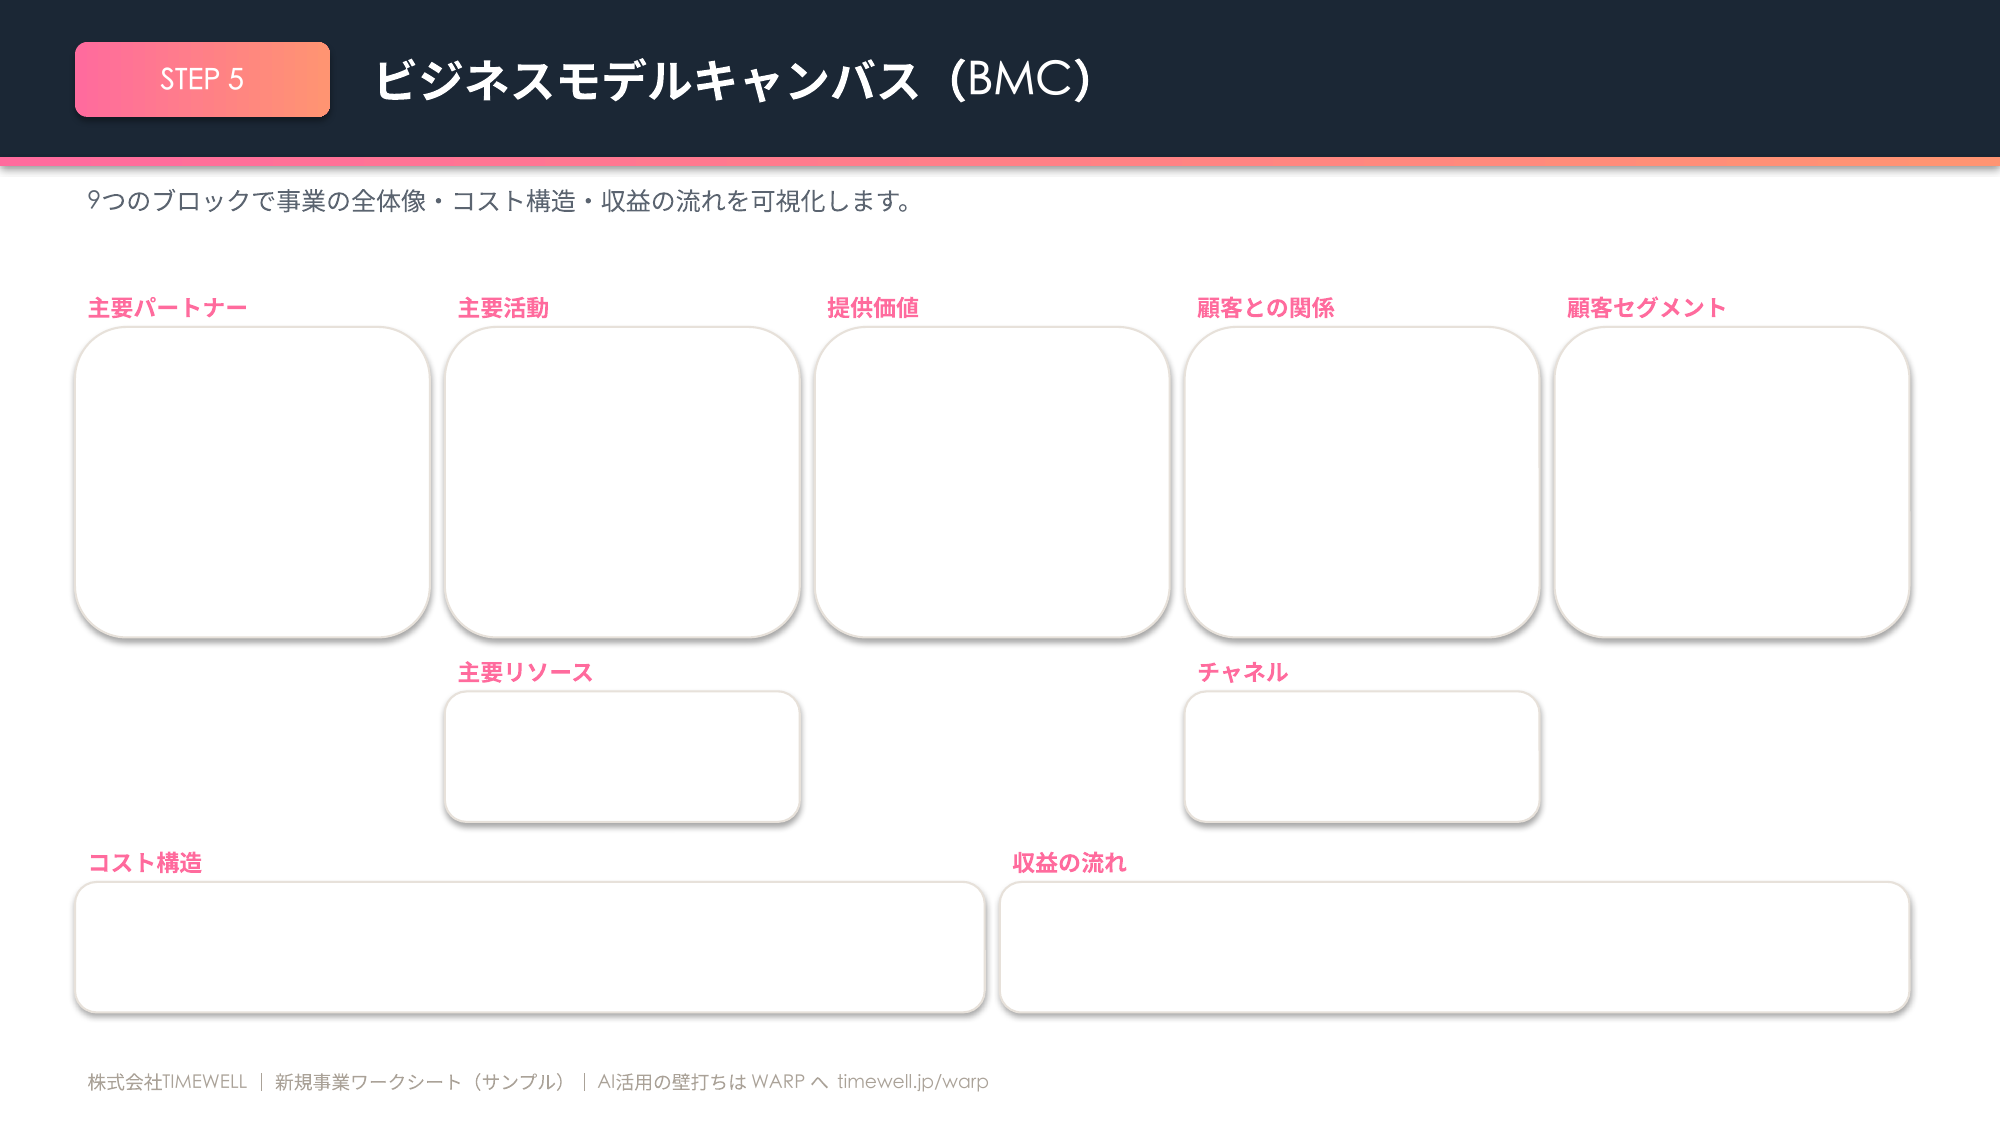
The canvas is made up of nine building blocks: Customer Segments, Value Propositions, Channels, Customer Relationships, Revenue Streams, Key Resources, Key Activities, Key Partners, and Cost Structure. Laying these nine out on one sheet lets you take in the logic of the entire business at a glance. When elements you had been thinking about separately are lined up side by side, gaps come into view, such as "we are supposed to deliver this value to this customer, but no means of delivering it has been prepared."
| Block | The question it answers |
|---|---|
| Customer Segments (CS) | Who is the business for |
| Value Propositions (VP) | Which of the customer's problems do you solve |
| Channels (CH) | How do you get known and deliver |
| Customer Relationships (CR) | What kind of relationship do you build |
| Revenue Streams (RS) | What do customers pay for |
| Key Resources (KR) | Which assets are essential to make it happen |
| Key Activities (KA) | What must you do every day |
| Key Partners (KP) | Who do you team up with |
| Cost Structure | What costs how much |
The canvas has a clean structure. The right half deals with the customer and value, the "who and what" that plays out front of stage. The left half is the infrastructure and efficiency, the backstage that supports the "how." Value Propositions sit in the center, connecting right and left. And if you look at the very bottom, the profit-and-loss structure shows up on one page too: profit is what remains when you subtract the Cost Structure at the lower left from the Revenue Streams at the lower right. The obvious equation of profit equals revenue minus cost is built into the very layout of the nine cells.
When you are thinking about a new business, the framework most often compared with the BMC is the Lean Canvas. Devised by Ash Maurya in 2010 for startups, it replaces four of the BMC's blocks, Key Partners, Key Activities, Key Resources, and Customer Relationships, with Problem, Solution, Key Metrics, and Unfair Advantage. A rough guide: use the BMC when you want to organize an existing business or the mechanics of a whole business, and the Lean Canvas for a freshly born new business where neither the customer nor the problem has been validated yet. Neither is superior; you choose based on what you want to verify right now.
Fill in the nine elements from right to left
The place people stumble most with the BMC is where to start writing. My recommendation is right to left. Begin with Customer Segments, then fill in the right half, Value Propositions, Channels, Customer Relationships, and Revenue Streams, before moving to the left half of Key Resources, Key Activities, Key Partners, and Cost Structure. Because this follows the natural order of thought, who you deliver value to, how you earn, what you need for it, and what it costs, you become more likely to notice leaps in your logic.
Before you start writing, let me share just one mindset. What you write here are not facts but hypotheses. Write one idea per sticky note, on the premise that you will later put them to customers to test. If you try to write the correct answer from the outset, your hand freezes. It goes faster once you decide that being wrong is fine and that you will swap the notes out later. For those who want to read along while working hands on, I have prepared a template you can write the nine cells straight into. Download the free sample PowerPoint template and fill it in alongside this article.
Writing the right half (customer, value, way of earning)
In the first block, Customer Segments, you make concrete who the business is for. A common mistake here is aiming it at "everyone." Narrow it down to age, occupation, situation, and specific pain points. As customer types, there is the mass market that targets a broad group, a niche that focuses on a specific narrow group, a segmented approach that splits into several fine-grained groups, diversification that serves distinct customer groups at once, and the multi-sided platform that simultaneously holds multiple customer groups who need one another, such as sellers and buyers. When you want to deepen the segmentation itself, sorting out the types of customer segmentation first makes this block far easier to write.
The next block, Value Propositions, is the heart of the canvas. Write out the jobs each segment wants done, the pains they carry, and the gains they want to obtain, and put into words the value that answers them. Do not give in to the temptation to boast about your own features here. What matters is not "what you can do" but "what is good about it for the customer." The sources of value are varied: novelty, performance, customization, design, brand, price, cost reduction, risk reduction, convenience, and more. If you want to dig deeper into the value proposition, use it alongside the Value Proposition Canvas, which pits the customer's jobs, pains, and gains against the provider's products and services, pain relievers, and gain creators. It is a dedicated tool for checking whether the two fit.
Design your Channels across five phases: awareness, evaluation, purchase, delivery, and after-sales. How do you get known, how do you help customers compare and consider, how do you get them to buy, how do you deliver, and how do you support them after purchase. Splitting these five stages apart reveals imbalances, such as pouring effort into awareness while after-sales is left blank. Consider too whether you do it yourself or leave it to partners, and whether it is direct or indirect.
In Customer Relationships, first decide which you prioritize: acquiring new customers, retaining existing ones, or raising per-customer spend. Then choose from types such as personal assistance with hands-on individual support, a dedicated-representative model, self-service where customers use it themselves, automated services where the system responds automatically, communities where users connect with one another, and co-creation where you build together with customers. If the stage you want to win at and the type of relationship you choose are out of step, costs pile up without results.
Revenue Streams is the work of making clear, for each segment, "what they pay for." The seven representative revenue types are as follows.
| Revenue type | How you charge | When it fits |
|---|---|---|
| Asset sale | Sell ownership outright | Providing a clear physical good or content |
| Usage fee | Pay per amount used, metered | Value scales with usage |
| Subscription | Pay a flat rate continuously | The more you keep using, the more value |
| Renting/leasing | Lend a usage right for a set period | Ownership is not required |
| Licensing | Grant a right to use IP | You hold technology or content |
| Brokerage fee | Take a portion of the transaction amount | You mediate between seller and buyer |
| Advertising | Take payment for exposure | You can gather many users |
These seven divide broadly into one-off transaction revenue and recurring revenue that accumulates month after month. Once you have chosen a type, multiply price by frequency by number of customers to roughly estimate monthly revenue. The key here is not to escape into wishful thinking. Who pays how much for what, and how often? A revenue projection where these four are not filled in is nothing but a wish. Also settle the direction at this stage on whether the price is fixed like a list price, or variable through negotiation or market linkage.
Writing the left half (the machinery and costs that support it)
Once the right half has settled "who you sell what to and how," the left half builds the underside that supports it. Key Resources are the assets essential to realizing the value proposition. People, technology, facilities, brand, capital, data, and so on go here. This is often the source of an advantage competitors cannot copy, so write it while conscious of where your winning edge lies.
Key Activities are what you must do every day to create and deliver value. List the movements that form the backbone of the business, such as manufacturing, matching, quality control, and content production. In Key Partners, write the alliances and suppliers for the parts you do not do in-house. The knack is to write what you put outside and why you team up with that particular partner. To gain economies of scale, to lower risk, to obtain resources you lack. An alliance whose reason you cannot state usually ends up being reconsidered later.
And last is the Cost Structure. Write out every cost that arises from the three elements on the left, and color-code them into fixed and variable costs. Fixed costs are those that go out every month regardless of sales; variable costs increase only in proportion to what sells. If these are not separated, you never see, right to the end, how much you have to sell to turn a profit. The Cost Structure has two directions: cost-driven, winning at a low price by squeezing costs to the bone, and value-driven, prioritizing high added value even at a somewhat higher price. Low-cost airlines are the former, luxury brands the latter. Along the way, check whether economies of scale, where each unit gets cheaper the more you make, and economies of scope, where resources can be reused across several businesses, are at work.
Get a rough break-even point out at this stage too. The idea is simple. The contribution margin is the price minus the variable cost per unit, and dividing the fixed costs by the contribution margin gives the number of sales needed to recover the fixed costs. For example, for a service at 1,980 yen a month, if the variable cost per member, such as payment-processing fees, is say 180 yen, the contribution margin is 1,800 yen per member. If the fixed costs are 2 million yen a month, dividing 2 million by 1,800 gives a break-even point of about 1,112 members. All the numbers can be placeholders. What matters is pinning down, with a formula, how many people you need before you clear the red. With this in view, it turns into a concrete goal of "how many more to go."
Looking for AI training and consulting?
Learn about WARP training programs and consulting services in our materials.
Filling in the nine cells with a fictional new business, "Tokowaza"
Since theory alone makes it hard to get your hand moving, let us fill in the whole thing with a fictional new business. Its name is "Tokowaza." It is an original example made for this article, unrelated to any real service. The business is an online-course-and-on-site-instruction matching platform that connects retired artisans (carpenters, plasterers, tatami makers, furniture makers, and so on) with individuals who want to renovate old houses, do DIY, or make use of vacant homes.
The Customer Segments are multi-sided, with three layers. On the learning side are people in their 30s and 40s, relocators and DIY enthusiasts, who have bought an old house and want to fix it up themselves. On the teaching side are retired artisans aged 60 and over who have both the skill and the time but whose work has dried up. Around them are local governments that want to move forward on vacant-home countermeasures. The Value Proposition changes for each. For the learning side, the value is acquiring the feel of the hand, which books and videos cannot convey, safely and without failure. For the teaching side, the value is turning their skill into a second income and a source of purpose, within a range that does not overtax their body.
The Channels were designed across five stages. Awareness through social media, relocation-focused media, and in-store at home-improvement centers. Evaluation through free introductory videos. Purchase by searching for an artisan and booking in the app. Delivery through online courses and on-site instruction in person. After-sales through a chat for consulting about progress. For Customer Relationships, a community where learners consult one another forms the base, combined with semi-individual matching to artisans and a review system.
The Revenue Streams were set up as three lines. The first is a matching fee for on-site instruction, a usage-fee type that takes 20% of the transaction amount. The second is an all-you-can-learn monthly membership, a subscription at 1,980 yen a month. The third is the sale of specially shot technique videos, which has the character of both asset sale and licensing. It is a hybrid combining recurring revenue and transaction revenue. The Key Resources are the network of artisans, the booking-and-payment platform, the accumulated technique videos, and the review data. The Key Activities are sourcing and vetting artisans, running the matching, producing course content, and managing quality and safety. In Key Partners, we placed home-improvement centers to team up with through referrals and discounts on tools and materials, local governments that link with vacant-home banks, and a non-life insurer that covers accidents during work. In the Cost Structure, the fixed costs are platform development and maintenance, personnel, and content production; the variable costs are performance-based payouts to artisans, payment-processing fees, and acquisition costs such as advertising. The direction is value-driven, winning on trust and quality rather than on cheapness, and because a video can be sold over and over once it is made, economies of scope are at work.
A common stumbling block for a new business is being satisfied with drawing only the flow of money. For platform types especially, whether the flows of money, goods, and services, plus information, are properly closed among three or more parties is what decides success or failure. Organized for Tokowaza, it looks like this.
| What flows | From | To |
|---|---|---|
| Course fees and monthly dues | Learner | Tokowaza |
| Payout net of the fee | Tokowaza | Artisan |
| Referral fee | Home-improvement center | Tokowaza |
| Technique instruction and videos | Artisan | Learner |
| Tools and materials | Home-improvement center | Learner |
| Reviews, requests, progress | Learner | Tokowaza |
| Track-record data and improvements | Tokowaza | Artisan |
| Demand data | Tokowaza | Local governments and partners |
Laid out this way, the shape of the Tokowaza business model comes into view. It is a multi-sided platform combined with a subscription and the sale of video assets. And the lifeline hypotheses that decide whether this model holds up also surface. One is whether learners will pay a few thousand yen a month for on-site instruction. The other is whether enough trustworthy artisans can be gathered. If those two miss, the business will not stand no matter how well everything else is arranged. That is exactly why you verify these two first with a small-scale test limited to one area, and then update the canvas.
Common mistakes with the nine cells, and how to avoid them
With the BMC, being able to fill it in is not itself the goal. Having taken new-business consultations for years, I feel many people stumble in the same places. Let me note a few representative ones.
The most common is a value proposition that becomes a self-centered list of features. No matter how many "we can do this" items you line up while out of step with the customer's jobs, pains, and gains, the customer's heart does not move. Once you finish writing, reread it once from the customer's standpoint. Next most common is the pattern of widening Customer Segments so far it becomes "for everyone." When the audience blurs, the value proposition and channels blur in a chain reaction. Having the courage to narrow to a single segment first ends up moving you forward faster.
In Revenue Streams, a conspicuous mistake is placing wishful-thinking revenue with no basis for price and frequency. A number you have not worked out to the point of who pays how much for what and how often is not a plan. In the Cost Structure, many cases proceed without splitting into fixed and variable, so the break-even point never comes into view to the end. Classifying is one extra step, but skip it and you end up running with no idea how much you have to sell to turn a profit.
Leaning too much on Key Partners so that your winning edge, the Key Resources and Key Activities, becomes thin is another dangerous pattern. Separate what you can put outside from the core you must never let go of. And finally, perhaps this is the most important, being satisfied once you have written the nine cells once. The canvas is not a finished product but a bundle of hypotheses to be tested. Put it to customers, and rewrite it when it misses. The moment you stop this back-and-forth, it becomes a mere picture. Incidentally, assuming that an idea is itself the business model is also a classic misunderstanding. An idea is only part of the value proposition. A model comes into being only when the whole of the way you earn and the machinery comes together.
Make AI your partner to run everything from the rough draft to verification
Having read this far, you may feel that filling in all nine cells alone is hard going. Honestly, using generative AI for the first rough draft is the fastest approach right now. Rather than agonizing from scratch, having AI write it once and then doubting that hypothesis with your own eyes raises the resolution of your thinking. Here I will leave a few prompts you can paste and use as is. Swap the business-idea part for your own words and throw it at the AI.
First, a prompt to knock out a rough draft of the nine cells all at once.
You are a business development consultant who supports new business launches. For the business idea below, fill in the nine elements of the Business Model Canvas in right-to-left order (Customer Segments -> Value Propositions -> Channels -> Customer Relationships -> Revenue Streams -> Key Resources -> Key Activities -> Key Partners -> Cost Structure) as concrete hypotheses.

# How to proceed
(1) First narrow Customer Segments down to age, occupation, situation, and specific pain points ("for everyone" is banned).
(2) Tie each Value Proposition to that segment's jobs to be done, pains, and gains.
(3) Split Channels into the five phases of awareness, evaluation, purchase, delivery, and after-sales.
(4) For Revenue Streams, state which type it is among asset sale / usage fee / subscription / renting-leasing / licensing / brokerage fee / advertising, and include unit price, frequency, and assumed number of customers.
(5) For the left half (Key Resources, Key Activities, Key Partners, Cost Structure), write only what is genuinely required to make the right half work.

# Output format
Output a table with the following columns:
| Element | Order to write it | Concrete hypotheses (3 to 5) | Assumptions this element depends on |
After the table, add a consistency check (3 to 5 lines) that reads the nine elements right to left as a single story.

# Constraints
- Abstract words such as "high quality," "convenient," or "easy" are banned. Go as far as numbers, proper nouns, and specific situations.
- For any unknown figure (amount, headcount, frequency), set a placeholder, clearly mark it "provisional," and add one line on the basis for it. Do not fabricate facts or data.
- Finally, list the three "lifeline hypotheses" that most need to be verified, each with how the business would collapse if it fails and the smallest way to verify it.

Business idea: [describe the business in 1 to 3 lines]
Target customer: [ ]
Problem to solve: [ ]
Once you have a rough draft, have the AI harshly grade whether the value proposition really resonates with the customer. This is a way to have blind spots you cannot notice yourself pushed on from the outside.
You are a new-business mentor who specializes in evaluating value propositions. Review the following Business Model Canvas entries harshly, without deferring to the author.

# Task
(1) Grade out of 10 whether the value proposition meshes with the customer segment's jobs to be done, pains, and gains, and state the basis for the score.
(2) Point out, quoting the relevant text, where it is misaligned, where assumptions are unsupported, and where it drifts into boasting about features and loses the customer's point of view.
(3) Identify which common new-business mistakes apply (aimed at everyone, self-centered, no basis for pricing, and so on).
(4) Propose three improved value propositions, each on a different axis of differentiation (novelty / performance / customization / price / risk reduction / convenience, and so on).

# Output format
- Score: X/10 (reason in one line)
- Findings: a numbered list (each item as "quote of the relevant passage" -> "why it is a problem" -> "how to fix it")
- Three improved value propositions: a table (columns = option / axis of differentiation / one-sentence value proposition / target customer it resonates with / biggest risk)

# Constraints
- Do not end with vague verdicts like "good" or "weak"; always go down to specific wording, numbers, and concrete scenarios.
- No flattery or encouragement; prioritize findings that lead to improvement. Do not fabricate facts or data.
- Finally, list the three assumptions that most need to be verified for this value proposition to hold.

[Paste the entries for the nine elements]
Having the AI produce several options for revenue design and estimation also broadens your view. The numbers can be provisional, but the point is to always have it show them with the calculation formula.
You are a business development consultant who specializes in revenue model design. Design the revenue streams for the following business.

# Task
(1) From the seven types (asset sale, usage fee, subscription, renting/leasing, licensing, brokerage fee, advertising), choose the ones that fit this business and present three combination proposals (stating the split between transaction and recurring revenue).
(2) For each proposal, set the charging target, unit price, assumed frequency, and assumed monthly number of customers, and estimate monthly revenue with the formula "unit price x frequency x number of customers."
(3) State the merits, risks, and preconditions of each proposal.
(4) Judge, with reasons, whether the price should be fixed (list-price style) or variable (negotiated / market-linked).

# Output format
- Comparison table of the three proposals: columns = proposal / combination of revenue types / charging target / unit price (provisional) / assumed frequency / monthly customers (provisional) / monthly revenue (with formula) / merits / risks
- After the table, state the one recommended proposal and why, in 3 to 5 lines.

# Constraints
- Numbers may be provisional, but always mark them "provisional" and never omit the formula (e.g., 1,980 yen x 1 time x 1,000 customers = 1.98 million yen).
- Abstract phrases like "profitable" or "stable" are banned; speak in specific figures for amount, headcount, and frequency. Do not fabricate data dressed up as real.
- Finally, list the three assumptions most likely to break in this revenue design (such as whether anyone will really pay this unit price), each with a way to verify it.

Business: [ ]
Customer: [ ]
Current price idea: [ ]
You can have it estimate the Cost Structure and break-even point in the same way.
You are a business development consultant strong in management accounting. Estimate the cost structure and break-even point of the following business model.

# Task
(1) Enumerate the cost items and classify them into "fixed costs" (go out every month regardless of sales) and "variable costs" (increase only in proportion to what sells).
(2) Evaluate whether economies of scale (each unit gets cheaper the more you make) and economies of scope (resources reused across several businesses) are at work.
(3) Subtract the variable cost per unit from the assumed unit price to get the contribution margin, then divide fixed costs by the contribution margin to estimate the break-even point (required number of customers and required revenue).
(4) Advise whether this business fits a cost-driven approach (winning on cheapness) or a value-driven one (winning on added value).

# Output format
- Cost classification table: columns = cost item / fixed or variable / rough monthly amount (provisional) / notes
- Break-even calculation: show the formulas with real numbers plugged in (contribution margin = unit price - variable cost; break-even = fixed costs / contribution margin; e.g., 2 million yen fixed / 1,800 yen margin = about 1,112 customers)
- Cost-driven vs. value-driven judgment: which one, plus reasons in 3 to 5 lines

# Constraints
- Set assumed numbers provisionally, always mark them "provisional," and never omit the formula. Do not fabricate facts.
- Instead of vague phrases like "it costs a lot," go down to the order of magnitude of the amount for each cost item.
- Finally, list the three input numbers most likely to be wrong (variable cost ratio, fixed costs, unit price, and so on) and note in one line how the break-even point shifts if each moves.

Business description: [ ]
Assumed unit price: [ ]
Known cost items: [ ]
Finally, a prompt to have it diagram the flows of money, goods, and information. It is well suited to checking whether the flows are closed in a platform-type business. The Mermaid diagram that is output will render as a diagram when pasted into a compatible tool.
You are a consultant who specializes in structural analysis of platform-type businesses. For the following business model, visualize the flows of money, goods, and information among the actors (customers, your own company, partners, government bodies, and so on).

# Task
(1) Enumerate all the actors.
(2) Organize what flows between each pair (money, goods, services, information), with direction.
(3) Output the diagram in Mermaid flowchart notation (flowchart LR). Each node is an actor, and each arrow label states both what flows and its category (e.g., |monthly fee (money)|, |hands-on instruction (service)|, |review data (information)|).
(4) Identify the points in the flow that are prone to getting stuck or whose viability is doubtful.

# Output format
- First, a Mermaid code block (flowchart LR, including all nodes and all arrows).
- Then a risk table: columns = risk (money does not circulate / information does not gather, and so on) / why it happens / which arrow it relates to / smallest way to verify it. List five risks.

# Constraints
- Write valid Mermaid syntax that renders as-is (watch for undefined nodes and unclosed brackets).
- Do not settle for optimism like "it will work out"; always point out flows that are not closed (no payment coming back, no recipient for the information, and so on). Do not fabricate facts.
- Finally, list the three assumptions that most need to be verified for this whole set of flows to hold.

[Paste the nine elements or a business overview]
Never simply believe the rough draft the AI produces. In the end, always check the consistency yourself. Read the canvas from right to left as a single story. "We deliver this value to this customer through this channel and earn this way. To do it, we need this, and it costs this much." Does this flow connect without contradiction, and does the revenue exceed the cost? If it does not, change the revenue type or the cost structure. Then pick about three lifeline hypotheses whose failure would collapse the business, and verify them with customer interviews or small tests. When results come in, rewrite the canvas. Keep this back-and-forth going as a living thing, rather than trying to complete it in one pass.
If you want your team to acquire the sense of making AI a partner in building a business, or you want a companion for the new-business launch itself, at our AI consulting service WARP we work through the design of exactly this kind of sparring and verification together. When you want to discuss where to start based on your own situation, reach out via the WARP individual consultation.
Summary
The Business Model Canvas is a tool for translating the business concept in your head onto one page and finding the gaps and contradictions. Finally, let me organize the points for getting moving today.
- Fill in the nine elements from right to left. Start with Customer Segments and end with the Cost Structure
- Choose the revenue stream from the seven types and estimate with price, frequency, and number of customers. Do not write wishful revenue
- Split costs into fixed and variable, and get the break-even point from the contribution margin
- Draw not only the flow of money but also of goods and information. For platform types, check that the three-way flows are closed
- Once you have written it, put it to customers. The canvas is not a finished product but a bundle of hypotheses to be tested
What I most want to convey is that the canvas is not the goal the moment you fill it in. When the nine cells are filled, it somehow feels as if the business is done. But the real start is from there, and the back-and-forth of throwing the lifeline hypotheses at customers and rewriting when they miss is what tempers the business. Once the BMC has shown you the whole picture, the next turn is to check how competitors are fighting in that market. You could go back to the previous step, how to generate ideas, and polish your value proposition again, or advance to the next step, how to do competitor analysis, and pin down where your winning edge lies. When you want to raise the precision of your revenue estimates, how to work out TAM, SAM, and SOM, which covers market sizing, is also helpful. A single sheet of paper should become a map you can return to whenever you get lost.
References
- Alexander Osterwalder, Yves Pigneur, Business Model Generation (2010)
- Alexander Osterwalder, "The Business Model Ontology: A Proposition in a Design Science Approach," doctoral thesis, Université de Lausanne (Faculté des hautes études commerciales), 2004 — the origin of the canvas 1
- Strategyzer (the firm co-founded by the canvas's originator), "The Business Model Canvas" 2
- Strategyzer, "The Value Proposition Canvas" 3