Market Sizing (TAM/SAM/SOM) Worksheet (editable PPT)
A market-sizing template that estimates TAM/SAM/SOM from users × price × frequency, separating fact from assumption.
Download the PPT (free)PowerPoint (.pptx) ・ no email required
Hello, this is Ryuta Hamamoto from TIMEWELL.
Whenever I take a meeting about a new business, there is one phrase I hear more than any other. "This is a one-trillion-yen market. If we can just take 1% of it, that's ten billion yen." On paper it sounds full of promise, but the moment an investor or a bank officer hears that sentence, they quietly close the deck in their mind. The reason is simple. Nowhere is there any basis for "if we can just take 1%." Sizing a market is not a contest to produce the biggest number. It is a test of whether you can explain, step by step, how far your business actually reaches and how much of that you can realistically capture.
This article is the eighth in a series that walks through building a new business in nine steps: "How to estimate business potential and market size." Using a fictional business as our worked example, we will cover how to slice a market into three views, TAM, SAM, and SOM, and how to do a rough estimate with Fermi estimation, doing the math all the way to the end. By the time you finish reading, you should be able to talk through the numbers in your own business plan with the reasoning attached. The map of the whole series is in the Complete Guide to the New Business Framework, and the step right before this one is in How to Draw a Competitive Advantage with a Positioning Map. If you want to measure your own AI readiness before you start doing the math, begin with the AI Literacy Check; it will make the discussion of AI use later in this article feel personal.
Slice the Market with Three Concentric Circles: TAM, SAM, SOM
Let's line up the terms first. Three views are indispensable when you talk about market size: TAM, SAM, and SOM. The acronyms look intimidating, but they are really just zooming into the same market in three stages, from the outside in.
TAM (Total Addressable Market) is the total demand for your product or service. It refers to the ceiling of the entire market, or what the revenue would be if you captured 100% of the share. SAM (Serviceable Available Market) narrows that TAM down to the portion your business model, channels, target region, target segment, and price band can actually reach. And SOM (Serviceable Obtainable Market) is the part of SAM you can realistically capture in the near future, given the competitive landscape, your own resources, and the speed at which you can win customers. It roughly corresponds to the share you can aim for over one to three years.
The three are nested: TAM ⊃ SAM ⊃ SOM. The largest circle on the outside is TAM, inside it is SAM, and the smallest circle at the center is SOM. Drawn out, they form concentric circles. If I had to name the single most important point here, it is this: the basis for your revenue target is not the outer TAM but the innermost SOM. TAM is background context that says "this market has a ceiling this high"; it is not your first-year revenue. The reason the "1% of a one-trillion-yen market" pitch fails to land with investors is that it swaps TAM straight into your own take.
| Metric | What it represents | Narrowing criteria |
|---|---|---|
| TAM | Total demand of the entire market (ceiling) | All potential demand, global or domestic |
| SAM | The range your business actually reaches | Region, channel, segment, price band |
| SOM | The part you can realistically capture | Competitors, your resources, speed of acquisition, time horizon |
This framework was not invented single-handedly by any one person. Trace it back and you find the theory of market segmentation (the STP concept, whose origins lie in the 1974 work of Wind and Cardozo), which is about dividing a market into segments and taking aim1. That idea spread through the world of startups and venture investing alongside customer development and the lean startup, and settled in as the standard set of metrics for pitch decks. That is precisely why, by looking at these three, an investor can tell at a glance how grounded an entrepreneur's grasp of the market really is. The size of the TAM (is there room to grow), the market's growth rate, and the basis for the SOM (is it built up bottom-up). These three points are what they look at.
Looking for AI training and consulting?
Learn about WARP training programs and consulting services in our materials.
Size the Market from Two Directions
There are broadly two ways to produce the TAM and SAM figures: top-down and bottom-up. In my view, these are not an either/or but a both. If you do only one, it will almost always skew high or low.
The top-down method starts from large public datasets such as industry reports and government statistics, then narrows them down in stages by criteria. Its advantage is speed, but the result depends entirely on the quality of the source data, and a loose narrowing tends to produce an inflated number. Suppose you are considering a piece of business software for the domestic market. According to the Economic Census, there are roughly 3.6 million companies in Japan (please confirm the exact latest figure on e-Stat). Narrow this to 20% by target industry and size and you get about 720,000 companies; narrow further to the 15% that have not yet adopted such software and have a budget, and you get about 108,000 companies. At an annual license fee of 120,000 yen, that puts the TAM at about 13 billion yen. Whether you can add one line explaining "why that percentage" every time you place a number is what separates a precise estimate from a shaky one.
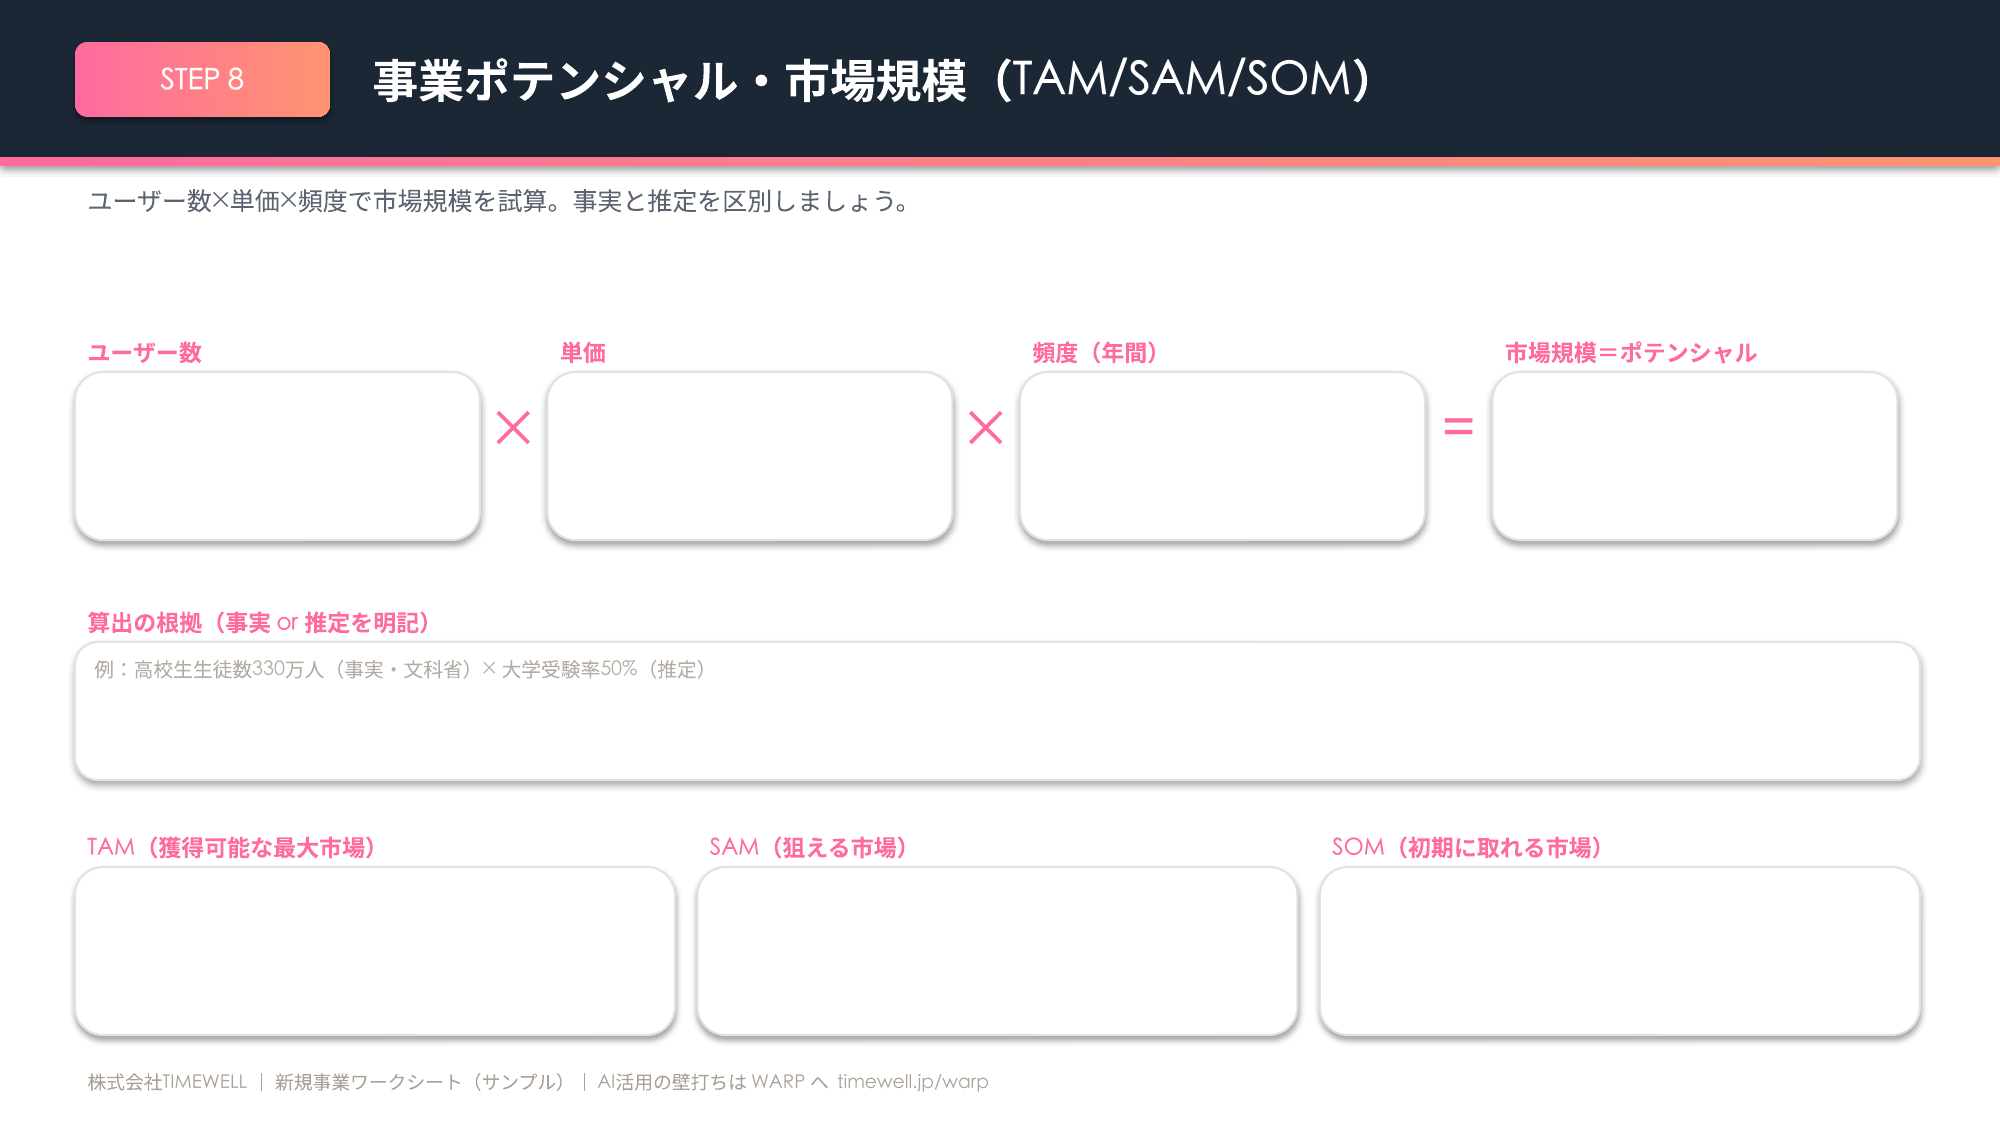
The bottom-up method multiplies the number of target customers by the average unit price and builds up from there. The basic formula is simple: market size equals the number of target customers times the average unit price. For a flow-type business such as a subscription, you multiply this by purchase frequency (the number of times per year or the length of retention) to annualize it. Written as a formula, it looks like this.
Market potential = potential customers x unit price x frequency
An astonishing number of people forget to multiply by that "frequency." Talk about a market with unit price alone and a subscription service ends up looking as small as a one-time sale. Because bottom-up rests on your own primary data and on-the-ground intuition, it is more credible, and it is also the one investors most want to see. When the top-down and bottom-up results diverge sharply, it is a sign that one of the assumptions is wrong, so don't leave it; reconcile them and find the cause.
If you get stuck on the first decomposition, using AI as a sounding board is quick. Copy the prompt below as is and replace the text in the brackets with your own business.
You are a business development consultant who has supported many investor-facing market-size estimates.

Target business:
- Business description: [   ] (be specific about the product/service and the customer problem it solves)
- Target region: [   ] (e.g., all of Japan, the Kanto area)
- Assumed unit price and pricing model: [   ] (e.g., a 10,000 yen/month subscription, a one-time 30,000 yen sale)

Estimate this business's TAM, SAM, and SOM using both the top-down and bottom-up methods. Proceed in the following steps.

(1) Top-down: name the real, specific public market data, government statistics, or trade-body surveys you start from (e.g., e-Stat, the Economic Census, an industry association's statistics), then narrow down in stages by target industry, size, region, and non-adopter share. For each narrowing step, add one line on "why that percentage."
(2) Bottom-up: build up with the formula "potential customers x unit price x purchase frequency (times per year or length of retention)." Show the figure and the basis for each factor.
(3) Reconcile the two results; if the order of magnitude diverges sharply, point out why and which assumption should be reconsidered.
(4) State the narrowing criteria for SAM and SOM (region, channel, segment, price band, time horizon).

Fix the output to the following structure.
- Under the heading "1. Top-down estimate," a table with columns "Narrowing step / Criterion / Remaining base / Basis." The last row shows the TAM amount.
- Under the heading "2. Bottom-up estimate," a table with columns "Factor / Value / Fact or assumption / Basis," plus the final market potential amount with its formula.
- Under the heading "3. Comparison of the two methods," both amounts, the divergence multiple, the cause of divergence, and which assumption to revisit.
- Under the heading "4. SAM and SOM narrowing," the TAM/SAM/SOM amounts and the narrowing criteria for each.

Constraints: Do not use vague words like "large market" or "promising"; write with concrete numbers and proper nouns (amounts, percentages, company counts, place names). For any figure you cannot confirm, place a provisional value and explicitly mark it "(provisional)," keeping the assumption and the formula. Do not fabricate statistic names or figures (mark anything whose existence is uncertain as "to be confirmed"). Finally, list the "top 3 weakest assumptions that most need verification in this estimate," along with how to check each.
Use Fermi Estimation to Nail the Order of Magnitude for "Unknown Numbers"
In both top-down and bottom-up work, there will always be a part where no public data exists. The newer the market, the more this is true. This is where Fermi estimation comes in. It is a technique for making a rough estimate at the order-of-magnitude level from limited information, and it takes its name from the physicist Enrico Fermi. He is famous for estimating the yield of an atomic bomb test on the spot, from how far scraps of paper drifted as they fell2.
The method breaks down into four steps. First, decompose the number you want to know into several factors you can estimate. Second, place a reasoned assumption on each factor. Third, multiply them together. Fourth, check whether the order of magnitude of the result is plausible. The key is to avoid one giant guess and split into small factors. If you overestimate one factor, underestimating another cancels the error out. That is why, the moment you turn it into several multiplications, you get better order-of-magnitude accuracy than you would expect.
A classic practice problem is "how many piano tuners are there in Chicago." You derive the number of households from the city's population, multiply by the ownership rate of pianos, multiply by the number of tunings per year, and divide by the number of jobs one tuner can handle in a year. This decomposition template applies directly to estimating market size. Replace population with potential customers, ownership rate with the share of your target segment, and tunings per year with purchase frequency, and it is already a bottom-up market-size estimate.
Trying to factor it out with your own head alone usually stalls partway through. Here, too, using AI reduces gaps in the decomposition.
You are a business development consultant who specializes in rough-sizing markets with Fermi estimation.

My new business:
- Business description: [   ] (be specific about the product/service and target customer)
- Target region: [   ]

Estimate this business's annual market size to the order-of-magnitude level using Fermi estimation. Proceed in the following steps.

(1) Decompose market size into the form "potential customers x unit price x purchase frequency," splitting further into finer factors where needed (population -> households -> ownership rate, etc.).
(2) For each factor, distinguish whether it is a "fact" to confirm in official statistics or an "assumption" you set as a hypothesis yourself.
(3) Place a concrete value on each factor, adding the reasoning behind each assumption.
(4) Calculate the annual market size in three cases: conservative, moderate, and aggressive.
(5) Run a sanity check on whether the order of magnitude is plausible (cross-check against a rough estimate from a different angle).

Fix the output to the following structure.
- Under the heading "Factor breakdown," a table with columns "Factor / Value / Fact or assumption / Statistic to reference or basis."
- Under the heading "Three-case estimate," a table with columns "Scenario (conservative/moderate/aggressive) / Value of each factor / Annual market size / Formula."
- Under the heading "Sanity check," the verification of whether the order of magnitude holds, and why.

Constraints: Avoid vague words like "a lot" or "fairly"; write with concrete numbers, percentages, and statistic names. For figures you cannot confirm, use a provisional value and explicitly mark it "(provisional)," keeping the assumption and the formula. Do not fabricate figures or statistic names. Finally, list the "top 3 factors that most swing the order of magnitude," and how to verify them first.
Do the Math: A Fictional Business Estimated All the Way Through
Here is where it gets real. Theory alone won't stick, so let's prepare one fictional new business and estimate it end to end, from TAM to SOM. The subject: "a service that delivers vet-supervised fresh, homemade meals for dogs on a subscription basis within Japan." All the numbers below are illustrative placeholder values. When you actually write a business plan, be sure to replace them with the latest primary statistics.
First, the most important preparation. Clearly separate facts from assumptions. Facts here are numbers you can back up with government statistics or industry-body data. The number of dogs kept in Japan and the size of the dog-food market fall in this camp. Assumptions, on the other hand, are numbers you set as hypotheses yourself. The share of premium-minded owners, the acceptance rate for online subscription delivery, the average spend per customer, and the share you can capture are in this camp. On your estimate sheet, color-code or annotate these two types so they can be told apart at a glance. Do this and, when an investor later asks "which parts are assumptions," you can answer instantly.
Grasp the rough shape with top-down. If we assume the domestic dog-food market is about 200 billion yen, that is the ceiling image of the TAM for the "dog meals" space. But fresh homemade food is only a tiny slice of that, so you must never confuse this 200 billion yen with your own revenue. It is strictly the background ceiling.
Next, build up with bottom-up. Assume there are about 6.8 million dogs kept in Japan (confirm the exact latest figure with pet-food industry-body surveys or e-Stat; this is in the "fact" bucket). Place the share of premium-minded owners at 15% (assumption), and of those the share who would accept online subscription delivery at 10% (assumption), and the potential customers come to about 102,000 dogs. Average spend is 10,000 yen a month times 12 months, or 120,000 yen a year (an assumed target price). If you assume you capture this entire potential layer, market potential is 102,000 dogs times 120,000 yen, or about 12.2 billion yen. This is roughly the size of the SAM and also the ceiling image of the SOM.
Then bring it down to a realistic SOM. Competitors will enter, and a company just off the ground can hardly capture the entire nationwide potential layer at once. So if you assume you can win 3% of the potential layer in year three, that is about 3,060 dogs. In annual revenue, about 370 million yen. This is the grounded three-year target for this business.
Now build a sensitivity analysis. Because moving a single assumption changes the conclusion dramatically, lay out a range across three scenarios: conservative, moderate, and aggressive.
| Scenario | Subscription acceptance rate | Captured share | Year-3 revenue |
|---|---|---|---|
| Conservative | 5% | 2% | About 100 million yen |
| Moderate | 10% | 3% | About 370 million yen |
| Aggressive | 15% | 5% | About 920 million yen |
Looking at this table, you can see that what most strongly swings the conclusion is the "acceptance rate for online subscription delivery" and the "average spend per customer." That being so, you should verify those two first, through small-scale test sales and surveys. A sensitivity analysis is also a map that tells you where to spend your money and time on verification next.
Finally, the sanity check. Revenue of 370 million yen is 3,060 dogs' worth. If one dog is one household, that is about 3,000 households. Since the number of dog-owning households in Japan is in the millions, 3,000 of them is not unreasonable as an order of magnitude. Against the 200-billion-yen dog-food market we saw top-down, a SOM of 370 million yen is a tiny slice. It is not an overstatement either. The order of magnitude is realistic, there is no double-counting, and TAM has not been mistaken for revenue. Once you have checked this far, the estimate finally becomes a "usable number."
Building such an estimate from scratch in Excel is a chore. So you can drop in your own numbers and go, I've prepared a template with the structure explained in this article. Download the free sample PowerPoint template and try plugging in the numbers for your own business.
Raise the Credibility of Your Numbers: Primary Data and Common Mistakes
The persuasiveness of an estimate is decided by which data you used and where you got it. Japan has more free primary information available than you might expect. The first thing to know is e-Stat, the portal for government statistics3. Population, number of households, number of business establishments, and many of the numbers that form the denominator of a market size are available here. If you want to know the number of companies or sales by industry, turn to the Economic Census run by the Ministry of Internal Affairs and Communications and the Ministry of Economy, Trade and Industry; for consumer-side trends, the various surveys of the Statistics Bureau. For industry-specific figures, the statistics published by that industry's trade body are your friend. Reports from private research firms are handy too, but the recommendation is to fix the skeleton with public primary sources first, then fill in the details with private data.
When you have no idea which sources to consult, having AI list them out finds the entrance to your research faster.
You are a market-research analyst well versed in Japan's official and industry statistics.

Target:
- Industry or market name: [   ]
- Numbers you want: [   ] (e.g., potential customers, number of households, market size, average unit price)

Build a list of Japanese primary information, official statistics, and industry statistics I should reference to estimate this market's size and number of customers. Proceed in the following steps.

(1) List the core statistics that form the denominator of market size (population, households, business establishments, number of companies).
(2) List the trade-body statistics and white papers that yield industry-specific figures (ownership rate, penetration, unit price, shipment value).
(3) For each source, state specifically "what numbers can be obtained" from it.

Fix the output to a single table with columns "Statistic/resource name / Surveying body / Where to obtain (URL or point of contact) / Numbers obtainable / Update frequency," ordered from the most reliable primary source down.

Constraints: Do not include secondary information such as personal blogs, roundup articles, or AI summaries of unknown provenance; prioritize primary sources from government, public institutions, and trade bodies. Do not list statistics whose existence you cannot confirm (mark uncertain ones "to be confirmed"). Do not fabricate statistic names or URLs. Finally, list 3 numbers that this list alone cannot fill and that require your own primary research (surveys, interviews, etc.).
On top of that, let me list the mistakes I see most often in the field. Just knowing the landmines to avoid ahead of time will sharply raise the quality of your estimate.
| Common mistake | How to fix it |
|---|---|
| Talking about TAM as if it were your revenue forecast | TAM is the ceiling; put the basis for revenue on SOM |
| Pushing it through with "if we just take 1% of the market" | Back it up bottom-up, building from the number of customers |
| Mixing facts and assumptions in your writing | Color-code statistics and hypotheses; attach reasoning to assumptions |
| Forgetting to multiply by purchase frequency or retention length | For flow-type, always annualize with "unit price x frequency" |
| Double-counting the same customer across multiple segments | Check for overlap between segments and remove duplicates |
| SAM nearly the same size as TAM | Narrow to the range you actually reach by region, channel, segment |
Once your estimate is roughly done, it's reassuring to attack your own numbers once before publishing, as if you were the investor. This, too, can be handed to AI.
You are a venture-capital investment lead evaluating a new business for funding, and you have critically vetted many market-size estimates.

Below is a market-size estimate I made.
[   ] (paste the TAM/SAM/SOM figures, the assumptions you placed, and the formulas)

Review this estimate harshly from an investor's perspective. Verify it one point at a time on the following angles.
(1) Numbers treated as "facts" that are really only "assumptions."
(2) Assumptions that are too optimistic (percentages, unit price, captured share, etc.).
(3) Suspicions of double-counting, order-of-magnitude errors, or a forgotten purchase-frequency multiplier.
(4) The highest-sensitivity variables that most swing the conclusion.

Fix the output to the following structure.
- Under the heading "Findings," a table with columns "Angle (1-4) / Location / Problem / Realistic alternative value / How to verify."
- Under the heading "Overall assessment," a 2-3 line verdict on whether this estimate would hold up with investors.

Constraints: Do not give vague notes like "too generous" or "needs more scrutiny"; get concrete about which number is optimistic in what way and what alternative value would be reasonable, in actual figures. Where a general market benchmark or statistic supports your point, add it (but do not fabricate figures; mark uncertain ones "to be confirmed"). Finally, list the "top 3 weakest assumptions in this estimate," along with how the conclusion changes if each one breaks.
Connect SOM to a Three-Year Revenue Plan
A market-size estimate does not end once it is produced. The SOM you have built up so carefully only carries meaning when it is connected to an actual revenue plan and KPIs rather than left as a pie in the sky. You put SOM, the "market you can realistically capture," in the denominator, and draw the pace of acquisition toward it year by year. The premises you should make explicit are the growth of your captured share, the number of customers acquired, the average spend per customer, and the churn rate. Place these four and you can build a simple revenue model from year one through year three.
For the dog fresh-food business from earlier, for instance, awareness is thin in year one, so you might capture 0.5% of the receptive layer, then 1.5% in year two and 3% in year three, raising the captured share in stages. Factor in the number of new customers acquired each month and a churn rate of a few percent per month, and the monthly revenue trajectory comes into view. Get this far and you have the material to decide how much you can spend on advertising and when you will turn a profit. This is the moment the market-size estimate first connects to management decisions.
Building the three-year model, too, is faster if you have AI make the first draft and then adjust it with your own gut feel.
You are a business development consultant who supports business planning and is well versed in designing revenue models for SaaS and subscription businesses.

Premises:
- My SOM (the market I can realistically aim for): [   ] (amount)
- Pricing model and average spend per customer: [   ] (e.g., a 10,000 yen/month subscription)
- Target customer and acquisition channel: [   ]

Translate this SOM into revenue targets for year one, year two, and year three. Proceed in the following steps.

(1) With SOM as the denominator, place assumptions that raise captured share in stages year by year (conservatively in year one, when awareness is thin).
(2) Make explicit the captured share, number of new customers acquired, average spend per customer, and churn rate (monthly), and build revenue up from monthly to annual.
(3) Add a one-line comment on the validity of each assumption.
(4) Show the sensitivity of revenue to movement in the key assumptions.

Fix the output to the following structure.
- Under the heading "Three-year revenue model," a table with columns "Year / End-of-year captured share / End-of-year customers / Monthly churn / Average spend / Annual revenue."
- Under the heading "Assumption validity comments," one line per assumption.
- Under the heading "Sensitivity," the swing in year-3 revenue when captured share and churn are each moved.
- Under the heading "KPIs to track monthly," three metrics, numbered, each with its definition.

Constraints: Avoid vague words like "grows smoothly"; write in concrete percentages, headcounts, amounts, and formulas. For figures you cannot confirm, use a provisional value and explicitly mark it "(provisional)." Do not fabricate figures. Finally, list the "top 3 assumptions most likely to break in this model," along with how to verify them.
As some of you may have noticed by now, sizing a market is a task with which AI is an excellent fit. Factoring the decomposition, proposing alternative values, playing the investor and poking holes, drafting the three-year model. A human decides "which assumptions to believe," and AI rapidly runs "given those assumptions, here is how the numbers come out." Once you can divide the labor this way, the quality of an estimate changes overnight. In our WARP service at TIMEWELL, former DX and data-strategy specialists from major firms provide hands-on support, from mastering AI as a partner in building a business to producing an actual business plan. It is precisely at the stage when you are unsure how to set your numbers, or worried your sensitivity-analysis assumptions have become self-serving, that an outside eye pays off.
Sizing a market is not a task of dazzling people with a big number; it is the work of stacking small assumptions one at a time until you yourself are convinced that "this business can reach at least this far." The numbers you build here become weapons directly in the next step. In the final installment of the series, How to Make a Pitch Deck That Distills Your Business onto One Page, let's shape this estimate into a form that gets through to investors. If you'd like someone to build the market size for your business alongside you, feel free to reach out through a WARP individual consultation. We'll help you turn your "if we just take 1%" into a single line with real evidence behind it.
References
Footnotes
-
Wind, Y., & Cardozo, R. N. (1974). "Industrial Market Segmentation." Industrial Marketing Management. Regarded as the origin of market segmentation (STP). TAM, SAM, and SOM took root as standard metrics in the practice of venture investing and entrepreneurship, built on this way of thinking. ↩
-
Fermi estimation (order-of-magnitude estimation), named after the physicist Enrico Fermi. On the Trinity test of 16 July 1945, the U.S. Department of Energy's Manhattan Project history records: "About 40 seconds after the explosion, Fermi stood, sprinkled his pre-prepared slips of paper into the atomic wind, and estimated from their deflection that the test had released energy equivalent to 10,000 tons of TNT." U.S. Department of Energy, Office of Scientific and Technical Information (OpenNet), "Trinity." https://www.osti.gov/opennet/manhattan-project-history/Events/1945/trinity.htm ↩
-
e-Stat, the portal site for official statistics of Japan (Statistics Bureau of the Ministry of Internal Affairs and Communications and others). Primary statistics that form the denominator of market size, such as population, number of households, and number of business establishments, can be referenced for free. https://www.e-stat.go.jp/ ↩