Competitor Analysis Worksheet (editable PPT)
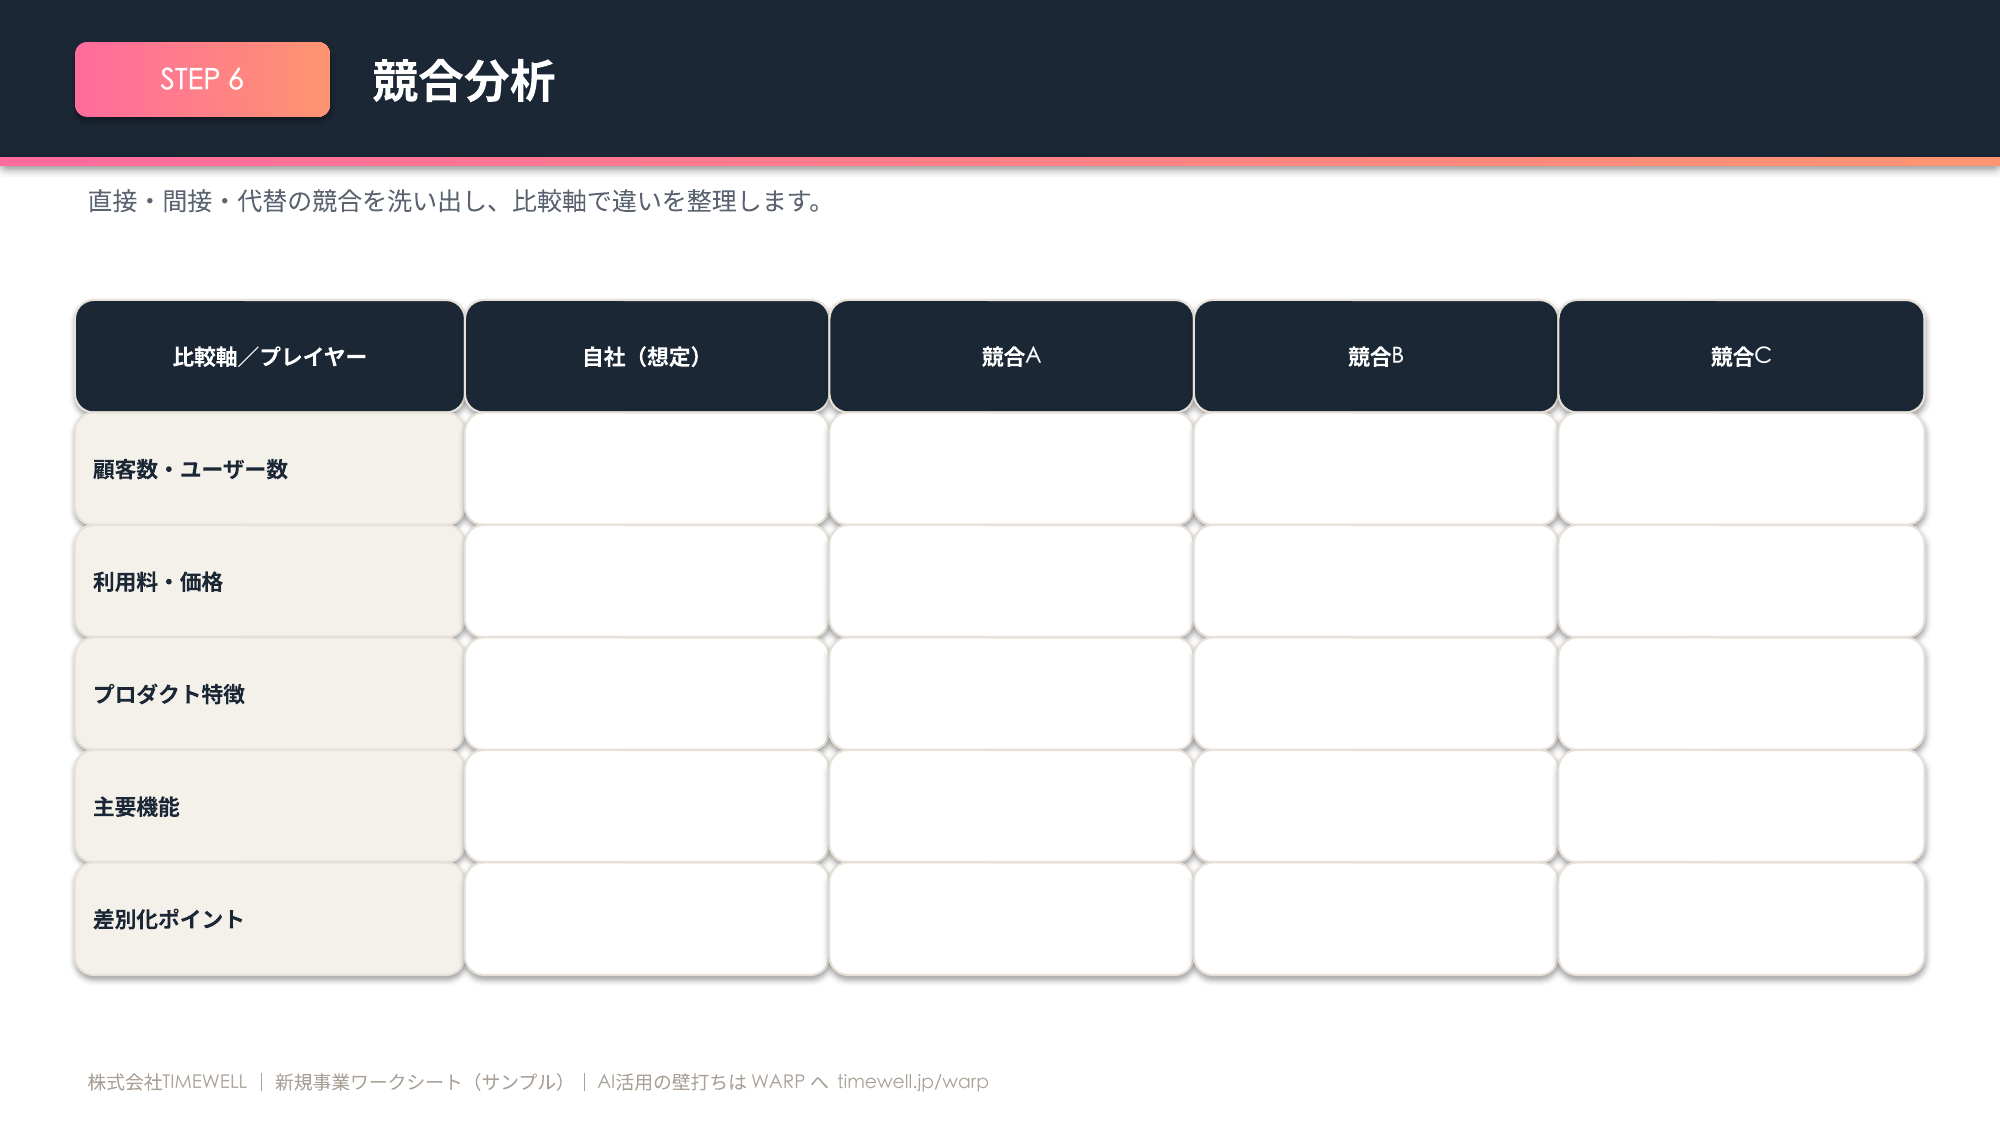
A competitor-analysis template that lists direct, indirect, and substitute rivals and organizes differences by axis.
Download the PPT (free)PowerPoint (.pptx) ・ no email required
Hello, this is Ryuta Hamamoto from TIMEWELL.
When I advise people on new businesses, the most wasteful pattern I see is stopping at "I think I looked at the competition." They line up five or six rival services, fill in a table with circles and crosses for features, and feel satisfied. Yet the crucial question, "So where do we actually win?", still has no answer. Competitor analysis is not about building a list. It is the work of pinpointing the winnable white space and the rivals who will out-muscle you in a head-on fight.
This article walks anyone starting a new business through a single continuous flow, from finding rivals to choosing comparison axes, to a comparison table you can copy and use, to drawing a positioning map. Partway through, I also include AI prompts you can paste in as-is. We will use a fictional business, "Ouchi-Deli" (a working name), and run through it from start to finish.
Let me hand you the map first. From here, this article proceeds in the following order.
- Where competitor analysis sits within the overall framework (the "C" in 3C analysis)
- How to surface rivals across three layers: direct, indirect, and substitute
- How to choose comparison axes based on what customers use to decide, and pour them into a copy-paste comparison table
- How to hunt for underserved white space with a positioning map
- A set of prompts for making AI your competitive-research partner
- How to convert the analysis into a differentiation hypothesis and an entry decision
This article is STEP 6 of a series that breaks the new-business framework into ten parts. The full picture is laid out in the Complete Guide to the New Business Framework. If you have come this far, through the previous step on the Business Model Canvas, this is the STEP where you finally turn your eyes outward, to the market and the competition.
Competitor Analysis Is the "C" in 3C Analysis
If you treat competitor analysis as a standalone task, you get lost halfway through. First, place it on the overall map. Competitor analysis is one corner of 3C analysis. 3C analysis is a framework for reading the market environment from three viewpoints, Customer, Competitor, and Company, proposed by management consultant Kenichi Ohmae. It spread around the world as the "strategic triangle" through his English-language book The Mind of the Strategist (McGraw-Hill, 1982), which followed his earlier Japanese book Kigyo Sanbo (企業参謀, 1975)12. Competitor analysis is the work of digging into the Competitor vertex of this triangle.
Why bother confirming its place in the whole? Because if you stare at a competitor in isolation, you lose sight of "whose problem, and what problem, that competitor is solving." Even if Competitor A has superior features, if those features are irrelevant to the customer you are targeting, it is no threat. Conversely, even a plain-looking service is a formidable rival if it cleanly solves the customer's biggest pain point. If you look at the Competitor without looking at the Customer, you cannot make this judgment. That is why the correct order is to start competitor analysis only after you have a firm grip on the customer's problem. Putting the customer's problem into words in the previous step was, in part, for this very reason.
Another tool that helps you decide the "scope" of competition is Michael Porter's Five Forces analysis. It was published in the Harvard Business Review in 1979 and systematized in his 1980 book Competitive Strategy3. It views the competitive structure of an industry through five forces: rivalry among existing competitors, the threat of new entrants, the threat of substitutes, the bargaining power of buyers, and the bargaining power of suppliers. What matters here is that it does not confine your rivals to "other companies in the same industry." New entrants not yet in the market, and substitutes that solve the same problem by an entirely different means, both count as part of the competition. This mindset connects directly to the three-layer sweep I explain next.
To summarize, the frameworks and their order of appearance go like this. First grasp the big picture with 3C. Next survey the competitive structure with the Five Forces. Then identify specific rivals and organize them with a comparison table and positioning map. Finally, use SWOT and the 4Ps (the marketing mix) to land on decisions about your own differentiation, pricing, and whether to enter at all. Competitor analysis sits in the middle of this flow. Incidentally, if you start agonizing over "which framework should I use," it is worth taking the AI Literacy Check to sort out your own working style. Tools are chosen to fit the goal; you do not need to use all of them.
Looking for AI training and consulting?
Learn about WARP training programs and consulting services in our materials.
Surface Rivals Across Three Layers (Direct, Indirect, Substitute)
From here we get our hands dirty. When you look for rivals, do not immediately search and line up same-industry players. Splitting your thinking into three layers reduces blind spots: direct competitors, indirect competitors, and substitute competitors.
A direct competitor offers the same product or service and satisfies the same need for the same customer. This is the easiest layer to find and the one you fixate on most. An indirect competitor offers something different but satisfies the same need or problem. A substitute competitor refers to a means of solving the problem without using the product category at all. Cooking for yourself, handling it in-house, and "doing nothing" (non-consumption) all belong here. The idea of substitutes and non-consumption corresponds to Porter's "threat of substitutes" and to management scholar Clayton Christensen's Jobs Theory (defining competitors around the "job" the customer wants to get done).
Why widen the net to include indirect and substitute rivals? Because in a new business, the toughest competitor is usually "sticking with the current way of doing things." No matter how good your service is, if the customer feels no dissatisfaction with the status quo, no switch happens. If you look only at direct competitors, you overlook this biggest wall of all.
Let me make this concrete with a fictional business. "Ouchi-Deli" (a working name) is a service that delivers ready-to-eat side dishes supervised by a registered dietitian, on a subscription basis, chilled, once a week, to dual-income households. The target is dual-income households with small children in urban areas. The job the customer wants done is: "On a weeknight, even when I'm exhausted, I want to put a healthy meal on the table without guilt." Writing out the three layers around this job looks like this.
| Layer | Rival (generic name) | Job it satisfies |
|---|---|---|
| Direct competitor | Other companies' subscription delivery of ready-to-eat side dishes | Prepare a weeknight dinner with health in mind and without effort |
| Indirect competitor | Meal-kit delivery, frozen bento delivery, online supermarkets | The offering differs, but "making the weeknight dinner easier" is the same |
| Substitute competitor | Home cooking / batch cooking, dining out / takeout, deli items from convenience stores or supermarkets, house-cleaning services, and "doing nothing" (everyone fends for themselves) | Solve the dinner problem without using the category |
Lining them up this way, the rivals outside the direct-competitor circle suddenly come into view. Ouchi-Deli's real opponent is not only same-industry delivery services, but also the non-consumption of "eh, the convenience store is fine today."
Let me make the search methods concrete too. The channels for gathering candidates are search engines, app stores, social media, Google Maps reviews, industry trade shows, and interviews with customers. Customer interviews are especially effective. Ask, "How do you currently prepare dinner?" and means you never considered rivals will pop out. Narrow each layer to three to five companies (or three to five means). Too many, and your hands freeze at the next step, the comparison. A common stumble at this stage is that surfacing the candidates itself eats up time. This is where letting the AI prompts introduced later draft the list moves things along at once.
Choose Comparison Axes Based on "What Customers Use to Decide"
Once the rivals are lined up, the next step is comparison. This is where many people stumble. They line up the features their own company is proud of and fill in circles and crosses. What they end up with is a self-serving feature-bragging table that is useless for judging who wins.
Set your comparison axes to match the criteria customers actually use when they decide. In marketing these are called Key Buying Factors (KBFs). If the axes are not the reasons a customer decides whether to pay, the comparison table tells you nothing. The basic set is six axes: price (unit price, fee structure, initial cost), customer scale or share (member count, user count, coverage area), characteristics (target, strengths, brand worldview), features (functions offered, scope of coverage), channel (routes for sales and customer acquisition), and review ratings. From these, narrow to five to eight axes that genuinely matter in your market. If you exceed ten, important axes and trivial axes stand side by side as equals, and you never reach a conclusion.
Once narrowed, weight the axes that matter most. Three levels, double circle, single circle, and triangle, are enough. For Ouchi-Deli, thinking about why a dual-income, child-rearing household chooses, "low effort" and "health-consciousness" would be double circles and "price" a single circle. This weighting becomes the foundation for choosing the two axes of the positioning map later.
Once the axes are set, pour them into a comparison table. Put competitors in the rows and comparison axes in the columns, and fill the cells with numbers or symbols. Set one rule here. Do not leave unfilled cells blank; write "to research." Unfilled cells are information gaps and targets for additional research. Left blank, you draw conclusions without noticing the gap. And always include a row for your own company (planned). In a table of competitors alone, you cannot see where you yourself stand.
Here is a template you can use as-is. It is filled in with the Ouchi-Deli example, but all the numbers are fictional and illustrative. Swap in your own company names and axes to fit your business.
| Competitor | Offering | Price per meal | Characteristics | Key features | Weaknesses |
|---|---|---|---|---|---|
| Direct competitor A (ready-to-eat delivery) | Chilled side dishes | approx. $4.50 | Nutrition-supervised, Japanese-food focused | Delivery can be skipped | Delivery area is city center only |
| Indirect competitor B (meal kit) | Ingredients + recipe | approx. $4.80 | Time-saving but requires cooking | Subscription, quantity changes | The effort of "cooking" still remains |
| Indirect competitor C (frozen bento delivery) | Frozen bento | approx. $4.10 | Long shelf life, nationwide delivery | Quantity changes allowed | Crowds the freezer, texture degrades |
| Substitute (home cooking / batch cooking) | Self-made | Ingredient cost only | Free, cheap | To research | Consumes time and willpower |
| Ouchi-Deli (own company, planned) | Chilled side dishes | approx. $4.30 | Fresh-made chilled feel + portioning for kids | Skip via app, portioning suggestions | Zero awareness, delivery cost |
Looking at this table, the outline of each company emerges: Direct competitor A is close to Ouchi-Deli on nutrition supervision but has a narrow delivery area, while frozen-bento C is strong on price and nationwide delivery but weak on texture. Only here does the comparison become material for a decision.
Hunt for White Space with a Positioning Map
A table organizes information, but "where is the opening" is not visible at a glance. That is where the positioning map (perceptual map) comes in. You take two of the customer's key buying factors that matter greatly and are mutually independent, and place competitors and your own company on a plane. It is a tool for visually confirming the crowded areas where rivals cluster (the red ocean) and the empty space where nobody is (the white space).
The biggest pitfall here is how you choose the two axes. Do not choose two highly correlated axes. For example, price and quality usually move together, "expensive things are good, cheap things are so-so," so competitors just line up along a diagonal from bottom-left to top-right. That reveals no differentiation gap. What you should choose are two independent axes, where fixing one does not fix the other.
For Ouchi-Deli, take "low effort" (from requires-cooking to just-reheat) on the horizontal axis and "health / nutrition consciousness" (from low to high) on the vertical axis. These two are independent. Being low-effort does not imply being healthy, and vice versa. Placing competitors on this plane, meal kits cluster around "effort remains x high health," and frozen bento around "no effort x medium health." Then it becomes visible that the top-right zone, "no effort x high health, and even portioning for children," remains surprisingly thin and unoccupied. That is exactly what Ouchi-Deli targets.
Of course, just because there is white space does not mean you should dive in unconditionally. Nobody is there perhaps simply because it is not profitable, or because it is hard to pull off. When you find white space, always pause once to question "why is this spot empty?" Drawing positioning maps runs deep, so from designing the two axes to validating the white space is covered in detail in Positioning Maps and Competitive Advantage. In this STEP, it is enough to master "visually confirming the openings" as one part of competitor analysis.
Make AI Your Competitive-Research Partner
To be honest, the work up to this point is tedious. Surfacing candidates, designing axes, drafting tables, summarizing. All of it eats time. This groundwork is exactly what generative AI is good for. The most practical way to use it is not to dump everything on AI and have it produce conclusions, but to have it make a rough draft that you then refine. I myself run AI in this order when sounding out new business ideas.
Start with surfacing the three layers. Replace the bracketed parts of the following prompt with your own business and paste it in as-is.
You are a competitive researcher supporting new-business development. For the business below, surface competitors split into three layers: "direct competitors / indirect competitors / substitute competitors (including non-consumption and self-solving)."

How to proceed:
(1) First restate, in one sentence, the job the customer wants done, and search for rivals around that job (do not confine yourself to the same product category).
(2) For each layer, list up to five concrete, real names (service names, company names, or named means). If you can only give a generic name, mark it "generic name (tentative)."
(3) For each competitor, add a one-line note on "why that customer chooses it," in terms of its offering and the job.
(4) Always look outside the direct-competitor circle (indirect and substitute), and include at least one substitute competitor for "sticking with the current way of doing things (non-consumption)."

Output format:
Present a Markdown table with these columns: | Layer | Name | Offering | Job it satisfies | Assumed target | Assumed price range (mark "tentative" if unknown) |
After the table, point out three easily overlooked substitute means as a bulleted list, each with a reason.
Finally, list the three assumptions or blind-spot risks in this sweep that most need verification.

Constraints:
- Do not settle for abstract words like "convenient" or "high quality"; be concrete down to the target customer, situation, and offering.
- Do not invent competitors that do not exist. Do not cite company names or numbers you are unsure of; where needed, mark them "generic name (tentative)" or "estimate (tentative)."
- For unknown numbers such as price or scale, use a placeholder and always mark it "tentative."

- Business description: [e.g., subscription delivery of ready-to-eat side dishes for dual-income households]
- Target customer: [e.g., dual-income households with small children in urban areas]
- The job the customer wants done: [e.g., on a weeknight, prepare a healthy meal without effort]
Next, designing the comparison axes and generating a comparison-table template. To keep the axes from being self-serving, the instruction prioritizes the key buying factors.
You are a business-development consultant for new businesses. For the business and competitors below, design customer-centric comparison axes and build a comparison-table template I can fill in directly.

How to proceed:
(1) Prioritizing "the criteria customers use to decide (Key Buying Factors, KBFs)," propose six to eight comparison axes, each with a one-line reason for "why it sways the customer's purchase decision." Base the axes on the reasons a customer decides whether to pay, not on features your own company wants to brag about.
(2) From the proposed axes, narrow to the top three that deserve the most weight, rate them on a three-level scale (double circle, single circle, triangle), and give the reason for that ranking.
(3) Build a Markdown comparison-table template with rows = each competitor (plus your own company, planned) and columns = the comparison axes. So I can fill it in, do not leave cells blank; enter "to research." If you put a tentative number, mark it "(tentative)."

Output format:
1. Axis list (a table of Axis | Reason for selection)
2. Weighting (a table of Top 3 axes | Symbol | Reason)
3. Comparison-table template (the first row includes your own planned company; columns are the proposed axes; unresearched cells say "to research")
Finally, list three points in this axis design that are easy to overlook or likely to lead to a wrong conclusion.

Constraints:
- Do not use abstract words (easy to use, high quality) as axis names; reduce them to measurable forms (price range, coverage area, churn rate, etc.).
- Do not fabricate facts. Always mark any tentative number or axis as "tentative" or "to research."

- Business description: [ ]
- Assumed competitors: [Direct: / Indirect: / Substitute: ]
- Business model (BtoB / BtoC, monetization type): [ ]
When you dig deep into a single competitor, paste in public information and have it summarize. The key is the instruction not to mix in speculation.
You are a business-development consultant specializing in competitor analysis for new businesses. Below I give you public information on one competitor (official site descriptions, price list, IR materials, press releases, reviews, etc.). Based only on this information, without mixing in speculation, and explicitly marking any thinly supported item as "no information," summarize the following.

How to proceed and output format (use exactly these headings):
(1) Primary target and value proposition
(2) Price range and fee structure (cite where each figure comes from; if not stated, write "no information")
(3) Three strengths and three weaknesses (for each, add a one-line note from the customer's viewpoint on "why it is / is not chosen")
(4) Main acquisition and sales channels
(5) Inferred barriers to entry (mark them clearly as "inference")
(6) A list of figures that require a primary source

Constraints:
- Do not supplement or invent anything not written in the information provided. When you infer, always mark it "inference" and quote the wording it rests on.
- Do not end with abstract judgments like "convenient" or "high quality"; go down to specific features, numbers, and conditions.
- Finally, list the three most uncertain points in this summary that are dangerous to rely on without verifying against primary sources.

---paste starts here---
[Paste the competitor's public information text here]
---paste ends here---
Finally, have it propose the two axes for the positioning map based on the comparison table. The instruction explicitly asks for two independent, weakly correlated axes.
You are a business-development consultant for new businesses. Based on the following competitor comparison table, design the two axes for a positioning map.

How to proceed:
(1) Propose three sets of "two axes that matter greatly (they sway the customer's purchase decision) and are mutually independent (weakly correlated)." Avoid highly correlated combinations, like price and quality, where competitors merely line up along a diagonal.
(2) For each set, explain the intent (what you want to make visible) and the cautions (correlation, hard to measure, etc.).
(3) Choose one recommended set, state why, and then place each competitor and your own company in words by high/low coordinates (e.g., top-right, bottom-left).
(4) Point out one underserved white space, then examine "why is that spot empty?" (possibilities such as not profitable, or hard to pull off).

Output format:
1. Axis candidates (a table of Set | Horizontal axis | Vertical axis | Intent | Cautions, three rows)
2. The recommended set and the reason for choosing it
3. Placement for that set (a table of Company | Horizontal high/low | Vertical high/low | One-line note)
4. The white space and three risks of targeting it

Constraints:
- Do not choose two highly correlated axes. State in one line the basis for independence (fixing one does not fix the other).
- Do not fabricate facts not in the comparison table. Mark any unclear placement as "to research (tentative placement)."

---Comparison table---
[Paste the comparison table you made in the previous prompt]
These are strictly rough-draft factories. Whether the competitors the AI cites actually exist and whether the numbers are real must always be checked against primary sources yourself. On the very idea of mastering AI as a partner in building a business, WARP, our AI consulting service, walks alongside executives and new-business leads, getting hands-on together. Not letting frameworks end as head knowledge, but getting to the point where you can run them on your own business, is where the real work is.
Convert the Analysis into a "Winning Path"
Even once you have a comparison table and a positioning map, they are only materials. The goal of competitor analysis is to put into words the winnable white space and the head-on collisions to avoid. Many articles and decks skip this and end at "we looked into it," but this final step is where the most value comes out.
First, summarize each competitor's strengths and weaknesses in one paragraph per company. Write the price range, primary target, acquisition channel, barriers to entry, and weak points from the customer's viewpoint, as "why it is chosen, and why it is not chosen." In the Ouchi-Deli example, frozen-bento C becomes "chosen for nationwide delivery and low price, but not chosen because of texture and freezer crowding."
On that basis, conclude with your own winning path. For Ouchi-Deli, fighting the frozen bento head-on with low price and nationwide delivery becomes a war of attrition where scale wins, which is unfavorable. So you arrive at a differentiation hypothesis: in the top-right zone of fresh-made chilled feel, portioning suggestions for children, and the flexibility of skipping via app, first enter by narrowing to dual-income, child-rearing households in the city center. The head-on collision to avoid and the white space to target are now in words.
Once here, return to 3C and the Five Forces and check for oversights. Did you forget to count the threat of substitutes and new entrants, or the bargaining power of the supply side and the customer side? Especially in "a market that appears to have no competitors yet," the true competitors, substitutes and non-consumption, are hidden. Once the check is done, connect to SWOT, the 4Ps, and estimating market size. How to measure market size is covered in the next STEP, Market Sizing (TAM, SAM, SOM). Even if you find white space, it is no business if that space is too small, so confirming the size is a set with all of this.
Let me also touch, finally, on where to get competitors' primary information. For listed companies, you can read securities reports and quarterly reports for free on EDINET, operated by Japan's Financial Services Agency4. They carry segment-level revenue, business strategy, and even risk information, so you can verify "is it actually profitable at that price range?" For unlisted rivals, estimate scale from job postings (the hiring locations for delivery bases reveal focus areas) and from membership figures announced in press releases. And above all, sign up and use the service yourself. Rather than swallowing secondary information like ads and sales decks, holding the actual usage experience as primary information raises the resolution of your comparison by an order of magnitude.
Here I will line up the common failures, as warnings. These are the ones I have seen again and again in consultations.
- Looking only at direct competitors and overlooking substitutes like home cooking and "doing nothing"
- Comparing with self-serving feature-bragging instead of the criteria customers use to decide
- Relying on competitors' ads and sales decks, and not taking primary information like actual usage, reviews, and financial statements
- Too many axes (over ten), no weighting, and no conclusion
- Choosing highly correlated axes for the positioning map, so no white space is visible
- Building it once, feeling satisfied, and never updating even as it goes stale with price changes and new entrants
- The analysis stops at list-making and never connects to decisions about differentiation, pricing, or entry
That last point about updating is plain but effective. Competitor information goes stale within a few months due to price changes, new entrants, and withdrawals. Note the acquisition date next to each data point, and set up a routine to review it regularly, such as once a quarter.
As an underlay for working through exactly as this article describes, we distribute a PowerPoint that provides frames for the comparison table and the positioning map. Its structure lets you go around once just by filling in the blanks. Download the free sample PowerPoint template and try it on your own business.
The more you do competitor analysis, the clearer it becomes what your company is truly chosen for. And in many cases, the winning path lies not in a flashy new feature, but in answering one plain thing customers quietly struggle with, more thoroughly than anyone else. Ouchi-Deli's "portioning suggestions for children" was exactly that. Where might the white space in your business be? If your hands freeze, let's sort it out together in a new-business sounding-board consultation. Next, we move on to Positioning Maps and Competitive Advantage, where you turn that white space into strategy.
Footnotes
-
Kenichi Ohmae, The Mind of the Strategist: The Art of Japanese Business, McGraw-Hill, 1982. The English-language book that presented the "strategic triangle" of customer, competitor, and company. Bibliographic record for the first edition (publisher and year): National Diet Library Search (NDL Search), https://ndlsearch.ndl.go.jp/search?cs=bib&keyword=The%20mind%20of%20the%20strategist%20Ohmae ↩
-
Kenichi Ohmae, Kigyo Sanbo: Senryakuteki Shiko towa Nanika (企業参謀:戦略的思考とはなにか), Diamond-Time, 1975. Ohmae's earlier Japanese book on strategic thinking, published seven years before The Mind of the Strategist. Bibliographic record: National Diet Library Search (NDL Search), https://ndlsearch.ndl.go.jp/search?cs=bib&keyword=%E4%BC%81%E6%A5%AD%E5%8F%82%E8%AC%80%20%E5%A4%A7%E5%89%8D%E7%A0%94%E4%B8%80 ↩
-
Michael E. Porter, "How Competitive Forces Shape Strategy," Harvard Business Review, March–April 1979 — the original article in which the five competitive forces were presented. https://hbr.org/1979/03/how-competitive-forces-shape-strategy — Systematized in Michael E. Porter, Competitive Strategy: Techniques for Analyzing Industries and Competitors, Free Press, 1980; bibliographic record: National Diet Library Search (NDL Search), https://ndlsearch.ndl.go.jp/search?cs=bib&keyword=Competitive%20strategy%20Porter ↩
-
Financial Services Agency (Japan), "EDINET" — officially the electronic disclosure system for documents such as securities reports filed under the Financial Instruments and Exchange Act (金融商品取引法に基づく有価証券報告書等の開示書類に関する電子開示システム), operated by the FSA and available 24/7. Filings available include securities reports, securities registration statements and large shareholding reports. Overview: https://www.fsa.go.jp/search/20130917.html — Viewing site: https://disclosure2.edinet-fsa.go.jp/ ↩