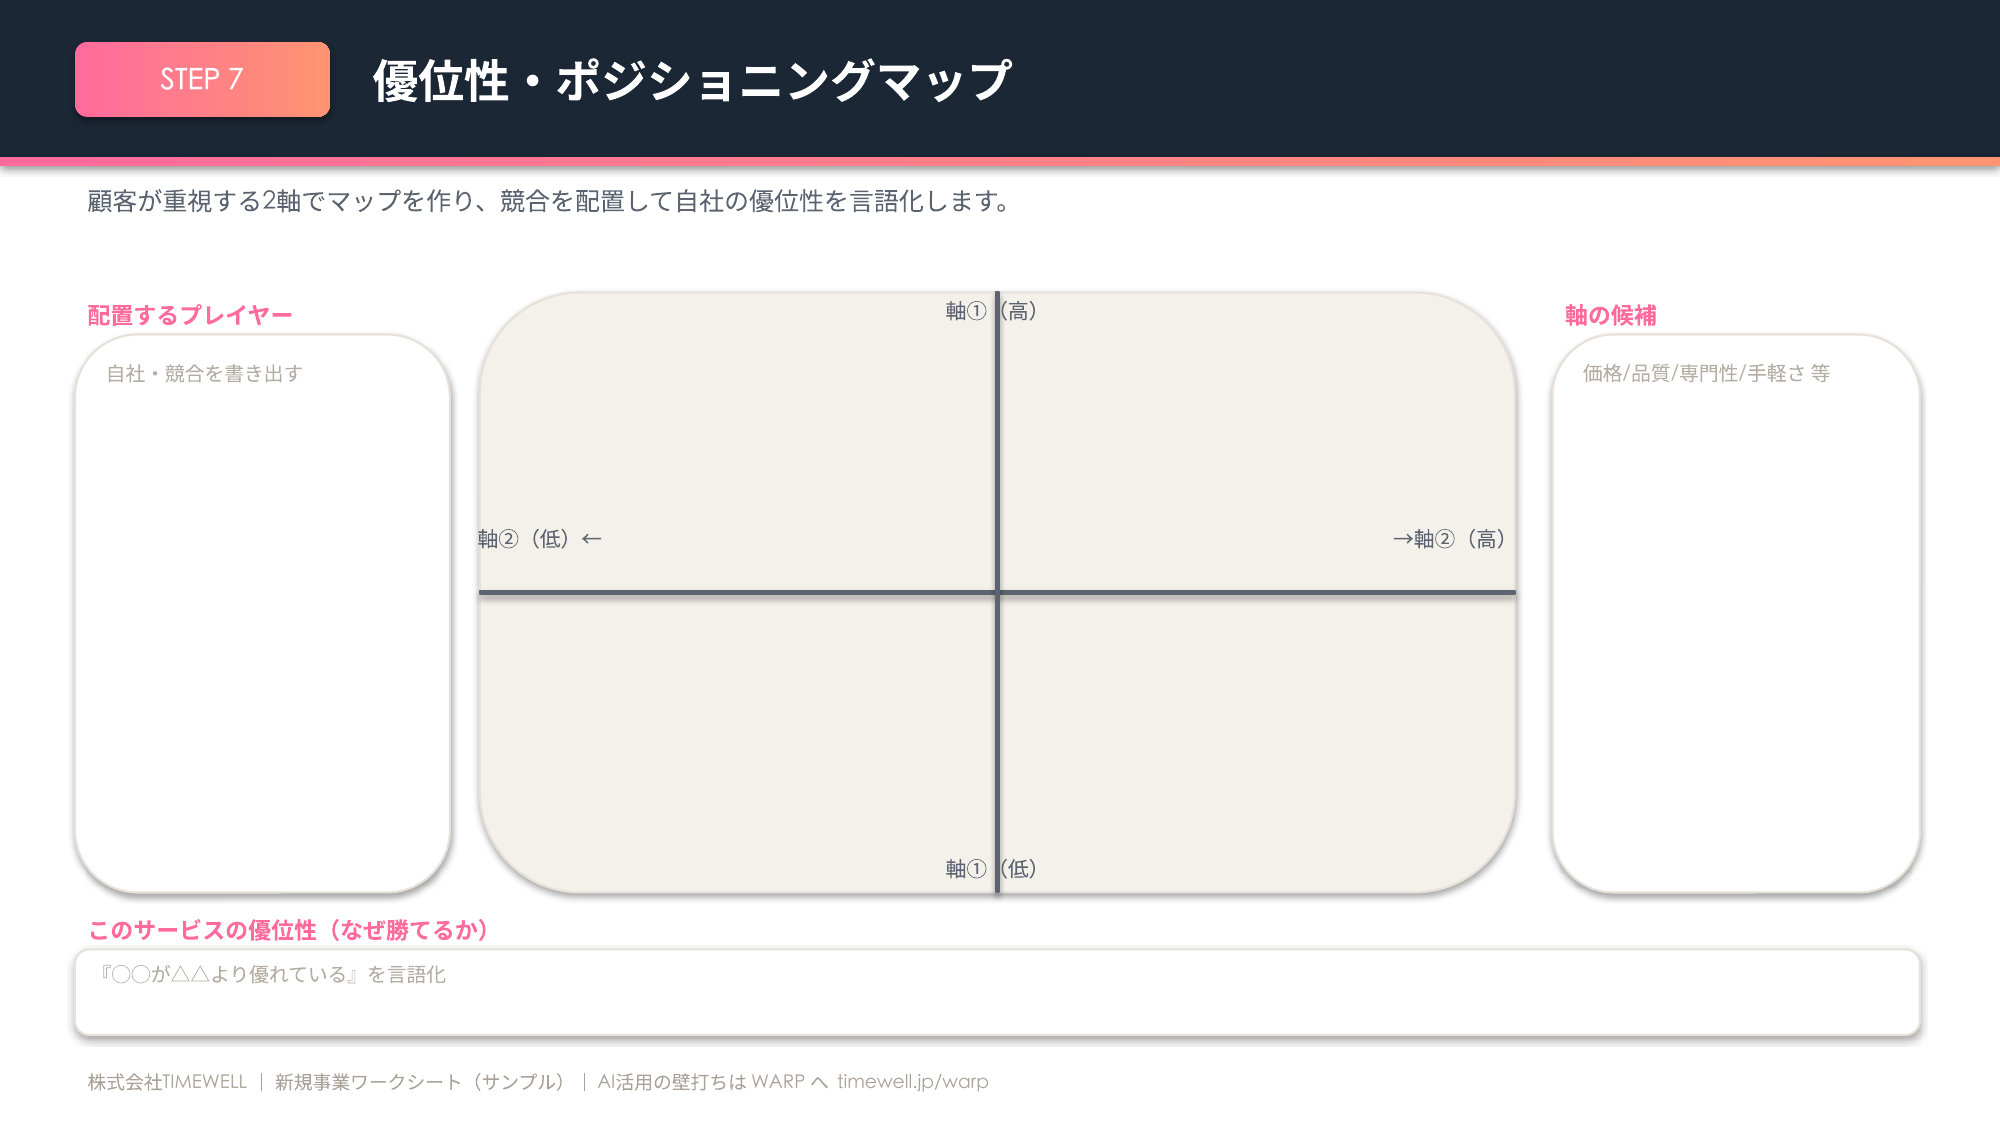
Positioning Map Worksheet (editable PPT)
A positioning-map template that plots rivals on two axes customers care about and articulates your advantage.
Download the PPT (free)PowerPoint (.pptx) ・ no email required
Hello, this is Ryuta Hamamoto from TIMEWELL.
When I advise people on new businesses, I often meet someone who has stalled right at the positioning map. Draw a square, plot two axes, place the competitors' dots, and put your own business in an open spot. That's all there is to the exercise — and yet somehow it won't move forward. The reason is clear: "I found an open spot, but I'm not confident I can actually win there."
In fact, the most heartbreaking case I've seen was a company that found beautiful white space, launched a business there, and within six months a large player moved into the exact same spot and buried them. The position on the map was correct. But there was no substance backing the ability to keep winning there. A positioning map is a map of "how to present yourself." It is not a tool that guarantees "why you will win." Whether you can hold these two apart in your mind is the single most important thing I want to get across in this article.
Three key points up front.
- A positioning map is a map of "how the customer perceives you (how you present yourself)." Competitive advantage and differentiation are about "why you can actually win (substance)," and you design them as separate things.
- The biggest hurdle in the build is choosing your two axes. The rule is to pick two uncorrelated factors from the customer's key buying factors (KBFs), and the ever-popular "price versus quality" is a combination to avoid.
- Once you claim white space, back up your ability to win there with VRIO. Differentiation that is easily copied ends up as nothing more than "temporary advantage."
If you're about to launch a new business, I've written this so you can start moving your hands with this article alone. If you want to see the full picture first, read the complete guide to the new-business launch framework, and for the step that comes just before this one — sizing up the competition — read how to do a competitor analysis alongside it. And before you tackle strategy work like this together with generative AI, if you want to know where you stand with AI, I recommend starting with a few-minute self-check on the AI literacy assessment.
What Is a Positioning Map? Separate "Presentation" from "Substance"
The people who popularized the word positioning were Al Ries and Jack Trout in their book Positioning: The Battle for Your Mind (1981)1. Earlier, in 1969, Trout had described positioning as a device in the mind that lets consumers simplify information and store it in a logical place. What matters here is the idea that positioning is not something a company "creates" at a desk — it is something you "win" inside the customer's mind. No matter how unique you claim to be, if the customer's memory files you carelessly next to a competitor, that is your position.
The chart that maps that "position in the mind" is the positioning map, also known as the perceptual map1. Within a given category, it shows how each brand is perceived by customers along two axes, vertical and horizontal. The standard procedure runs like this: choose two relevant variables as axes, ask customers where each brand sits, average the responses and plot them, visualize the competitive landscape, and look for white space where demand exists but competitors are thin. The textbook axis combination that always shows up is "price versus quality" — but for reasons I'll explain later, I don't recommend it.
Here I want to pause on the relationship between the positioning map and competitive advantage. What the positioning map answers is "how the customer perceives you." What competitive advantage and differentiation answer is "why you can actually win." The former is about perception, the latter about substance. The business I mentioned at the start — the one that claimed white space but got buried — confused these two. Even if you claim the prime real estate in the upper right of the map, without the resources and capabilities to keep winning there, the position is just a picture on paper. Conversely, even if you have the substance, if it isn't placed in the right position inside the customer's mind, you won't be chosen. Keep a sense that these two have to line up together.
One more thing to keep in mind: positioning is not a standalone task. In marketing, the three stages of dividing the market finely (segmentation), deciding who within it to target (targeting), and designing how to present yourself to that target (positioning) are collectively called STP. Positioning is the final step of STP. The concept of segmentation was proposed by Wendell R. Smith in 1956, and this body of thinking was widely popularized by Philip Kotler. In other words, if you start drawing the map before you've locked down "who you're selling to," the axes won't settle and you'll wobble. If it feels like your target is still fuzzy, going back to customer segmentation for a moment is the faster route in the end.
Looking for AI training and consulting?
Learn about WARP training programs and consulting services in our materials.
How to Build a Positioning Map [STEP 0–STEP 9]
Here is the actual procedure. If you reached this article by searching for "how to build a positioning map," what you most want isn't abstract theory but numbered, concrete steps — so I've broken it into ten stages. You don't have to do all of it perfectly at once. Start by moving your hands and drawing one sheet, then raise the precision afterward. To give you a foundation to work from, I've prepared a sample slide deck that follows this article. It includes axis templates and a worked example, so if you'd like to fill it in as you go, help yourself.
Download the free sample PowerPoint template
STEP 0 is to respect the order. As noted in the previous section, first decide the S and T of STP — "which market" and "who within it you'll target." If the target isn't set, the axis selection that follows will always wobble.
STEP 1 is to surface the customer's key buying factors (KBFs). Write out ten to twenty factors your target customer uses as the basis for choosing, drawn from sales-floor interviews, surveys, word of mouth, and the voices you hear in real deals. List everything you can think of — price, lead time, quality, low effort, thorough support, design, expertise, and so on. The items you list here become your candidate axes.
STEP 2 is to choose two of them as your axes. There are three criteria: high importance in the customer's decision, the two axes being uncorrelated with each other, and a gap appearing between you and your competitors. This choice of two axes is the biggest hurdle in the whole build, so I'll dig into it in full in the next section.
STEP 3 is to place competitors and yourself on the map. Choose three to six major competitors and place where each of them sits along the two axes. Don't forget to place your own planned business too. Estimate competitors' positions from publicly available information and your own analysis. There's no need to rely on links to or quotations from other companies' sites, and as a matter of policy this article doesn't do that.
STEP 4 is to look for white space. Compare the red-ocean areas where competitors cluster with the spots where no one is. But don't instantly conclude "empty = opportunity." This is where beginners stumble most. The reason no one is there might just be that there's no demand, so no one supplies it. When you find white space, always ask yourself "why has no one gone here until now?"
STEP 5 is to decide your own position. Narrow it to a single point of white space that has demand and where you can win. If you get greedy and aim at several positions at once, you fall into what Porter calls "stuck in the middle" (covered in the next section), and you appeal to no customer at all. Aim at one point.
STEP 6 is to articulate your advantage — "why you can win there." Verify the basis for winning at the position you chose, one point at a time, through the four lenses of VRIO (covered below). Inimitability is especially crucial; differentiation that is easily copied doesn't last. Also make clear here which of Porter's three generic strategies you'll fight with.
STEP 7 is to distill it into a positioning statement. Boil it down to one sentence: "For [target customer], our [product/service] is the [category] that delivers [value/unique standing], because [the basis for an advantage competitors can't copy]." Only when you can write this far does your differentiation become something you can communicate to others.
STEP 8 is validation. Put the statement and map in front of a handful of target customers and confirm whether "they find that positioning appealing" and whether it "becomes a reason to choose you over others." If it doesn't land, something is off in the axes, the position, or the advantage.
STEP 9 is to update it regularly. When competitors move, the map changes. Redraw the map at least once every six to twelve months and check whether your advantage has been copied and slipped into merely temporary advantage. Drawing it once, pinning it to the wall, and calling it done is meaningless.
Digging into the Biggest Hurdle: "Choosing Your Two Axes"
Nine out of ten people who stumble in the build get stuck on this choice of two axes. Let's take this part carefully.
The principle is one thing: choose your axes from the customer's key buying factors (KBFs). Even if you conveniently pick an axis you're good at and draw yourself in the upper right, it means nothing if customers don't choose along that axis. For example, a company confident in its technology often wants to put "high technical capability" on an axis — but if customers actually choose on lead time and support, that axis ends in self-congratulation. Choose your axes strictly from the customer's point of view.
The next rule to observe is to make the two axes uncorrelated with each other. If you pick correlated axes, every player lines up on a single diagonal from upper right to lower left, and you can't tell where the openings are. The textbook regular "price versus quality" is exactly this: higher-priced products tend to be higher quality, so the dots tend to line up diagonally. I recommend that first-time builders in particular avoid this "price versus quality" pairing. Look for two factors that don't move together — like "cooking effort" and "expertise in nutritional design" — where one can be high while the other moves freely.
For when you can't think of candidate axes, here's a summary of commonly used perspectives, along with how to tell a good axis from a bad one.
| Candidate axis (KBF example) | Conditions that make it a good axis | Conditions that make it a bad axis |
|---|---|---|
| Price, cost | The category is one customers choose on price | Placed on the same axis as quality, making them correlate |
| Quality, performance | Can be quantified; anyone can judge the position | Left as the vague word "high quality" |
| Effort, ease | The burden in use clearly becomes a differentiator | Customers don't actually care about the effort |
| Expertise, specialization | The gap shows clearly in a niche market | Set up only to flatter your own strengths |
| Lead time, speed | A key factor tied directly to the decision | Everyone in the industry is level, so no gap shows |
| Support, hands-on help | A factor that matters for ongoing use | For one-off purchases, customers don't value it |
| Design, worldview | The category is chosen on sensibility | Too subjective to agree on the position |
If you're unsure, a practical move is to try three or four axis combinations and adopt the one where differentiation shows most clearly. With the same set of competitors, simply changing the axes shifts both the clusters and the openings. A common failure here is making vague words like "high quality," "reassuring," or "easy to use" into axes. These are interpreted differently by different people and can't be compared. Make them concrete down to a granularity anyone can judge, such as "does it finish in five minutes of heating or less?"
Building a Map and an Advantage for the Fictional Business "Yoraku"
Since the explanation has stayed abstract, let me launch one fictional new business and run through it from start to finish. This is an original example made for this article, unrelated to any real service or book.
The business is called "Yoraku." It's a weekday-evening meal-kit delivery service aimed at dual-income households with preschool-age children. Imagine a service where, using the ingredients that arrive, you use almost no knife and no measuring, and in five minutes of heating you have a dinner designed to meet a child's nutritional needs.
First, lock down STP, especially the target. The market is dinner solutions for households. The target is dual-income households in urban areas with children aged three to six. I narrowed it to the segment that feels "I'm completely out of time, but I don't want to compromise on my child's nutrition." Because I narrowed here, the axes fall into place.
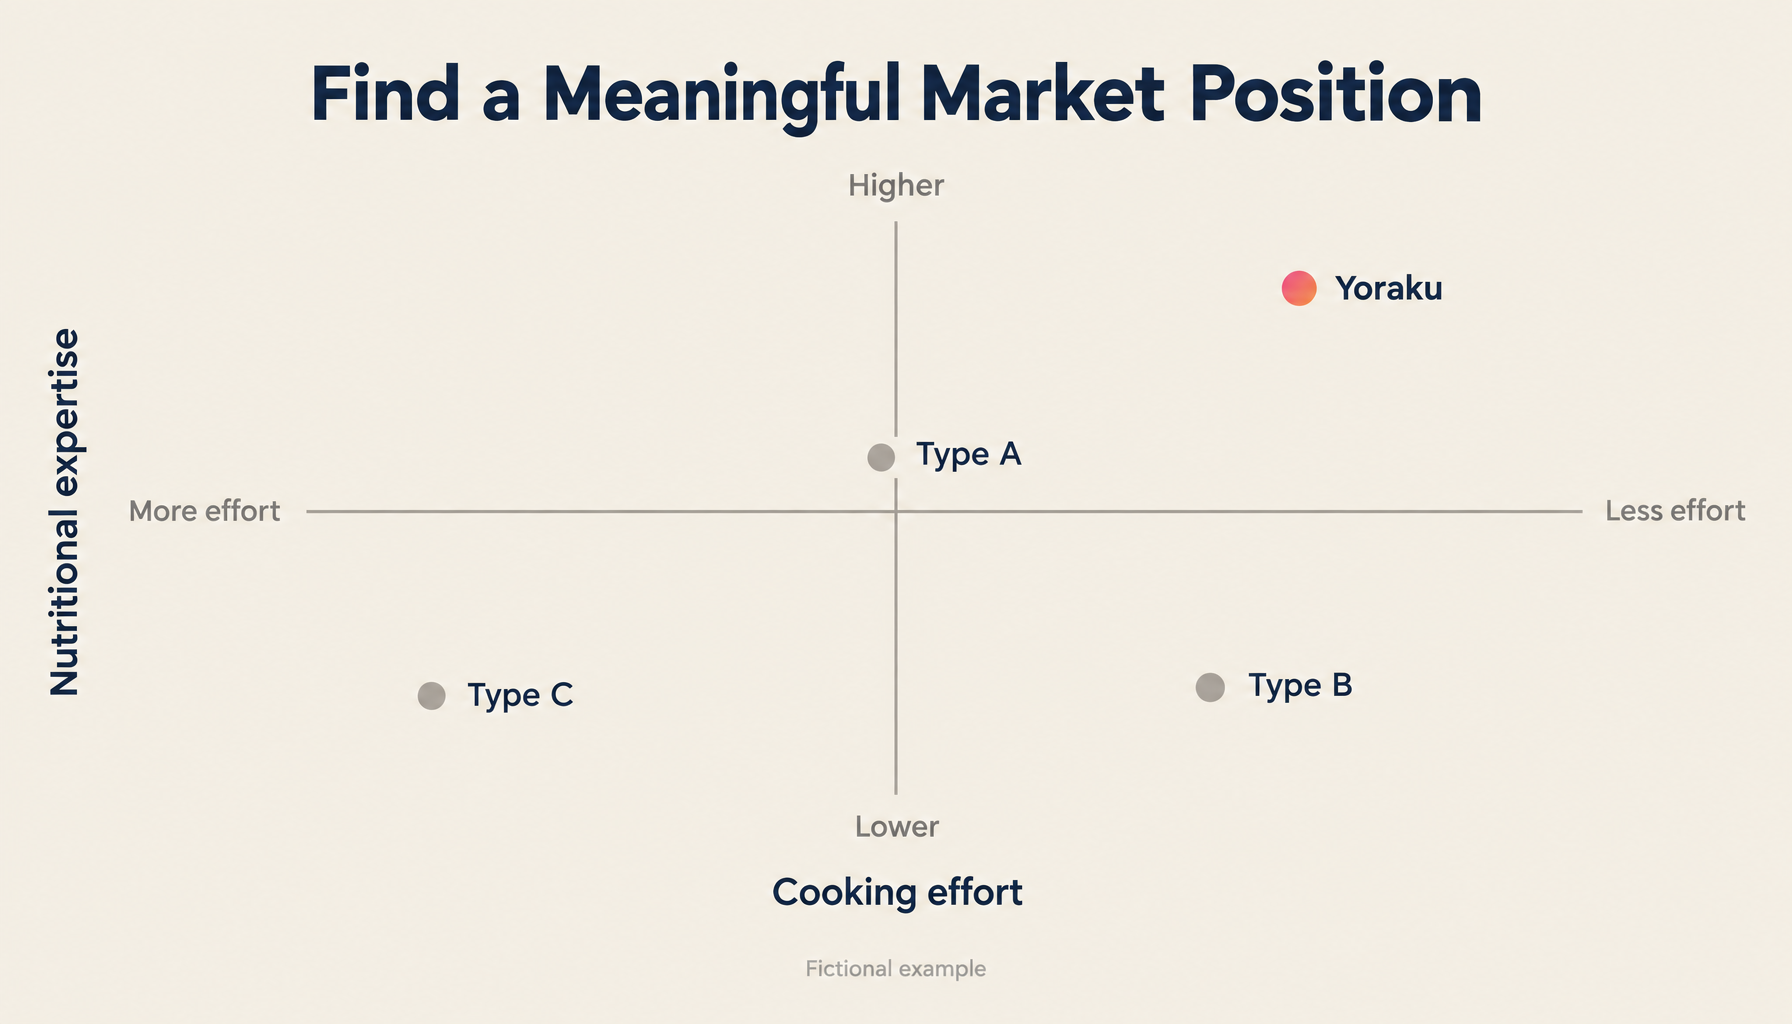
After surfacing the key buying factors, I adopted two uncorrelated axes. The horizontal axis is "cooking effort," with the left meaning it takes effort and the right meaning almost zero effort in five minutes. The vertical axis is "expertise in nutritional design," with the bottom meaning a general menu and the top meaning designed for children by a registered dietitian. Effort and nutritional expertise don't move together, so there's no worry of the dots lining up diagonally. The point here is that I deliberately avoided "price versus quality."
I place competitors as types rather than by individual company name. Large meal-kit Type A has medium effort and general nutrition, so it clusters near the center of the map. Frozen home-delivery meal Type B has almost zero effort but general nutrition (mainly for singles and older adults), so it's in the lower right. Recipe-and-ingredient home cooking Type C takes effort with so-so nutrition, so it sits from the lower left toward the center. Placing them this way, you can see that the upper right — "zero effort in five minutes, plus genuine nutritional design for children" — is wide open. This is the white space Yoraku targets. Verifying why it's open: given the rise in dual-income households and high interest in children's nutrition, I judged that demand exists but supply is thin. That's the feel of white space that isn't demand-free.
The target position is fixed in the upper right. The hypothesized basis for winning is three points: "know-how in developing recipes for children, an in-house team of registered dietitians, and an in-house time-saving prep line built together with local producers." Whether this basis is real gets verified with VRIO in the next section.
Keeping Your Advantage from Ending Up "Temporary" | VRIO and Porter's Generic Strategies
The person who systematized the theory of competitive advantage is Michael Porter. In his book Competitive Advantage (1985), he positioned competitive advantage as the attributes specific to a firm that allow it to outperform its rivals2. On that basis, Porter asserts that there are basically only three ways to fight: cost leadership, where you provide the same thing at lower cost and win on price; differentiation, where you justify a higher price with unique value others don't have; and focus, where you narrow to a specific segment and choose either cost or differentiation within it. Choose one of these three, is Porter's claim. Chase all three at once and you become "stuck in the middle," where no advantage emerges. In Yoraku's case, you can frame it as focusing on the child-rearing household segment and then setting yourself apart by combining nutrition and time-saving — a combination of focus and differentiation.
So, once you can call it differentiation, are you safe? Here lies a pitfall. Differentiation that is easily copied doesn't last. In 1991, Jay Barney defined sustained competitive advantage as being in a state of implementing a value-creating strategy not simultaneously being implemented by current or potential competitors3. Not being copied for the moment isn't enough; whether you can maintain a state that is hard to copy is the dividing line. The business I mentioned at the start — buried by a large player within six months — precisely lacked this durability.
This is where VRIO analysis comes in. Barney first published it as VRIN (Value, Rarity, Imitability, Non-substitutability) in 1991 and revised it to VRIO in 19954, a framework that verifies whether an advantage is real through four questions. V is economic value: does the resource let you seize opportunities and counter threats? R is rarity: do competitors lack it? I is inimitability: does copying it take major cost or time? O is organization: do you have the mechanisms and structure in-house to make use of the resource? The verdict is expressed in stages — competitive disadvantage, competitive parity, temporary advantage, an advantage you're failing to exploit, and sustained competitive advantage. Think of it as a tool for not leaving your advantage at "somehow strong," but articulating it and backing it up.
Let me run Yoraku's hypothesis through VRIO. V: because it delivers both time-saving and children's nutrition, there is strong customer value — Yes. R: few providers can translate child-specific nutritional design into a time-saving kit — Yes. I: while the recipes themselves can be copied, an in-house line combining a producer network and prep work takes time to build — somewhere between medium and Yes. This is the biggest battleground and the part to keep strengthening. O: there's an in-house team of registered dietitians and the structure to run logistics — Yes. Taken together, the verdict is that Yoraku sits close to sustained competitive advantage, with strengthening inimitability being the key going forward. If inimitability came out weak, you'd shift investment toward assets that take time to copy — accumulating proprietary data, long-term contracts with exclusive partners, and nurturing a brand and community.
This kind of "core organizational capability that competitors can't easily copy" is called core competence in management studies. Proposed by C.K. Prahalad and Gary Hamel in 1990, it forms the foundation of sustained advantage2. Claiming a good position on the positioning map and holding core competence to defend that position are separate tasks. Only with both in place does a business become sturdy.
The one sentence that sums up everything so far is the positioning statement. For Yoraku, it goes like this: "For time-pressed dual-income child-rearing households, Yoraku is the weekday-evening-only meal kit where a dinner designed by a registered dietitian with children in mind comes together in five minutes, because it combines child-focused nutritional-design know-how with a time-saving supply chain built in-house down to the prep work." The first half is how you present yourself; everything from "because" onward is the substance that backs it up. When these two connect, your differentiation truly gets communicated. Incidentally, when I actually showed it to five child-rearing households, the reaction was: "Zero effort exists elsewhere, but designing my child's nutrition too — that's what hits home." The differentiation point came across as intended, a good sign. If you're now curious about the work of translating your advantage into the language of "delivered value," take a look at the value proposition canvas as well.
Generating Axes, Placing Competitors, and Stress-Testing with Generative AI (Prompt Collection)
To be honest, both the work of choosing two uncorrelated axes and the work of critically verifying demand for the white space tend to narrow your view when done alone. This is where using generative AI as a sparring partner makes things surprisingly easier. Personally, for generating candidate axes I often have the AI produce more than ten first, then have a human choose from them. Below are prompts corresponding to each step of this article. Replace what's in the square brackets with your own business and paste them in as they are.
A prompt to generate candidate axes.
You are a business-development and marketing-strategy consultant specializing in new ventures. You will design the two axes of a positioning map for the business below.

Input
- Business: [   ]
- Target customer: [   ]
- Main competitor types: [   ]

Task
(1) List 15 key buying factors (KBFs) the target customer actually weighs when deciding. Make each KBF concrete enough that anyone can judge a position on it (e.g., not "high quality" but "ready in five minutes of heating or less"). Do not leave abstract words like "high quality," "convenient," or "reassuring" as-is.
(2) From the 15, propose 3 pairs of two axes that satisfy: (a) large impact on the decision, (b) uncorrelated with each other, and (c) a gap appears versus competitors.
(3) For each pair, explain why the two axes can be said to be uncorrelated — with a concrete reason why one can be high while the other moves freely — and judge whether there is a co-movement risk like "price versus quality."

Output format
First, output a "KBF list" as a table with these columns: | No | KBF (concrete wording) | Why this customer weighs it |
Then, output "Axis candidates" as a table with these columns: | Pair | X axis | Y axis | Why uncorrelated | Co-movement risk (yes/no + basis) | Differentiation this pairing reveals |
Finally, state the one recommended pair and the reason in three lines or fewer.

Constraints
- Do not fabricate facts. Do not invent unverified numbers or proper nouns about competitors or the market. Where an estimate is needed, mark it "(assumption)" and add one line of premise.
- Avoid abstract words (high quality, convenient, and the like); go as far as the specific situation, number, or proper noun.
- End with three weak hypotheses or risks that most need verification, each paired with what you would check to close it (self-critique).
A prompt to map competitors and analyze the white space.
You are a consultant specializing in competitive analysis for new ventures. Build a positioning map on the given two axes and critically evaluate the white space.

Input
- X axis = [   ] (left = low / right = high)
- Y axis = [   ] (bottom = low / top = high)
- Us: [   ]
- Competitor A / B / C: [   ]

Task
(1) For us and each competitor, estimate the position on the X and Y axes on a 10-point scale (1–10) and give the (X, Y) coordinates. Add one line of basis per player.
(2) From the coordinates, identify the red-ocean areas where competitors cluster.
(3) List the white spaces where no one is, and for each critically evaluate "is demand present but supply thin, or is it empty simply because there is no demand?" Always add a hypothesis for "why has no one gone here until now?"
(4) Recommend exactly one white space that has demand and where we have a plausible chance to win.

Output format
First, output a "placement table" with these columns: | Player | X score (1-10) | Y score (1-10) | Coordinates | Basis of estimate |
Then, output a "white-space evaluation" table with these columns: | White-space location (quadrant or coordinate band) | Demand likely? (yes/no/unknown + basis) | Hypothesis for why it's empty | Can we win there? |
Finally, summarize the one recommended white space, with reasons to target it and reasons to avoid it, in three to five lines.

Constraints
- Coordinate scores are estimates. Mark any unverified number "(assumption)" and give a basis within publicly available information. Do not fabricate facts.
- Do not conclude "empty = opportunity" on reflex. Never recommend white space that is empty only because there is no demand.
- End with the three most fragile premises in this analysis (hypotheses that, if wrong, collapse the conclusion), each with what you would research to verify it (self-critique).
A prompt to verify your advantage with VRIO.
You are a competitive-strategy consultant. You will rigorously test, with a VRIO analysis, whether a business can actually keep winning at the position it targets.

Input
- Target position: [   ]
- Current hypothesis of strengths (basis for winning): [   ]

Task
(1) Test the stated strengths against the four VRIO lenses, one at a time. V = economic value (does it seize opportunities and counter threats?); R = rarity (do competitors lack it?); I = inimitability (does copying it take major cost or time?); O = organization (are the mechanisms and structure in-house to exploit the resource?).
(2) Judge each lens Yes / No (use "Medium" when it's a close call), and give the reason, going as far as the specific situation, resource, or capability that justifies it.
(3) From the four lenses combined, conclude which stage it reaches: competitive disadvantage, competitive parity, temporary advantage, an unexploited advantage, or sustained competitive advantage.
(4) If inimitability (I) is weak or "Medium," propose three concrete measures to make it harder to copy (toward assets that take time to copy — accumulating proprietary data, long-term contracts with exclusive partners, nurturing brand and community).

Output format
First, output a "VRIO verdict table" with these columns: | Lens | Question | Verdict (Yes/No/Medium) | Reason (concrete) |
Then, state the "overall verdict" in one line (one of the five stages) with its basis in three lines or fewer.
Finally, list "measures to raise inimitability" as a numbered list of three, each with a rough cost/timeframe estimate (an assumption is fine).

Constraints
- Do not settle for "somehow strong." Avoid abstract words; state which resource, capability, or situation makes the case.
- Mark any unverified cost or timeframe "(assumption)" and add the premise and rough basis. Do not fabricate facts.
- End with the three weak premises most in need of verification — where this advantage would break down if they fail (self-critique).
A prompt to create a positioning statement.
You are a consultant specializing in brand strategy and copywriting for new ventures. Using the information below, design a positioning statement that communicates.

Input
- Target: [   ]
- Value delivered: [   ]
- Advantage (a basis competitors can't copy): [   ]
- Category: [   ]

Task
(1) Create 3 positioning statements following this template: "For [target], [our service] is the [category] that delivers [unique value], because [a basis competitors can't copy]."
(2) Vary the angle across the three: Statement 1 = feature appeal, Statement 2 = customer-pain appeal, Statement 3 = against-competitor appeal.
(3) Add one tagline of 60 characters or fewer to each statement.
(4) For each, self-check whether the part after "because" (the substance) genuinely supports the first half (the presentation).

Output format
Output a table with these columns: | No | Angle | Positioning statement (full) | Tagline (≤60 chars) | Does presentation connect to substance? (yes/partly + one note) |
After the table, state the single most recommended statement and why, in three lines or fewer.

Constraints
- Do not use abstract words like "high quality," "convenient," or "reassuring" in the value or the basis. Go as far as the specific situation, number, or named resource.
- Do not add facts not in the input (track record, awards, figures). Do not fabricate. If you want to supplement, mark it "(to be verified)."
- End with three reasons this statement might fail to land or fail to be believed by customers (self-critique).
A sparring prompt to find the holes in the map you've made.
You are a sharp-tongued reviewer who combines the perspective of an investor evaluating new ventures with that of a formidable competitor. Point out the holes in the positioning map I'm about to show you, without flattery.

Input
- Two axes: [   ]
- Our position: [   ]
- Basis of advantage: [   ]
- Competitors' positions: [   ]

Task
Check the following four points especially hard: (1) whether the two axes are actually uncorrelated (do they avoid lining up on a single diagonal?); (2) whether the axes are the customer's key buying factors (not axes that merely flatter us); (3) whether there is truly demand in the white space we target (or is it empty only because there is no demand?); (4) whether it's only "how we present ourselves (position)" and lacks the backing of "why we can win (advantage)."
For each point, judge whether there is a problem, and give the concrete basis for that judgment together with a specific improvement suggestion.

Output format
Output a table with these columns: | Point | Problem? (yes/no/to verify) | Basis of the critique (concrete) | Improvement suggestion |
After the table, write "If I were the competitor, how would I kill this business" as three scenarios, each in two to three lines.
Finally, give a provisional judgment on whether to invest, and name the single most important thing to verify that could overturn that judgment.

Constraints
- Don't praise. Rather than listing strengths, focus entirely on holes and risks.
- Make no assertions without basis. Mark guesses "(speculation)" and add what would settle them. Do not fabricate facts.
- Don't leave critiques abstract; name specifically which axis, which coordinate, or which basis is weak.
AI is good at producing a large number of candidate axes and at mercilessly poking at your convenient assumptions, but the final judgment is a human job. In particular, don't take the AI's estimate of "is there really a customer in that white space?" at face value — put it in front of a handful of real targets and confirm. We also offer a service called WARP that supports building the very structure for using AI as a partner in business creation. If you feel you need hands-on support — from introducing frameworks to embedding AI in internal decision-making — consider it as an option.
Summary
Used well, a positioning map is a powerful tool that shows the direction of a new business on a single sheet. But it is only a map of "how to present yourself." What I don't want you to forget is the one point I've repeated throughout this article.
- Choose two uncorrelated axes from the customer's key buying factors. Avoid "price versus quality."
- Even when you find white space, ask "why has no one gone here until now?" and verify demand before targeting it.
- Narrow your target to a single point. Get greedy and you become "stuck in the middle," appealing to no customer.
- Once you have your position, back up "why you can win" with VRIO and Porter's generic strategies. Go as far as designing to raise inimitability.
- Redraw it every six to twelve months. Keep checking whether your advantage has been copied.
A new business is a continuous series of moments where you speak in hypotheses with no track-record data yet. That's exactly why whether you can put both wheels — "presentation" and "substance" — into words as a set of map and advantage is what decides whether you can persuade investors and your own organization. Today's sheet doesn't have to be perfect. Draw it, put it in front of people, and fix it. This back-and-forth is what turns desktop white space into a real path to winning.
The next step is estimating just how large the market you're targeting actually is. Move on to how to estimate market size (TAM, SAM, SOM) to check whether the position you've decided is large enough to stand up as a business. If you'd like to sharpen your strategy together with AI, or want hands-on support translating frameworks into practice, let's map out the concrete approach together in a WARP individual consultation.
References
Footnotes
-
Al Ries and Jack Trout, Positioning: The Battle for Your Mind (1981). The discussion of positioning here draws on this book. ↩ ↩2
-
Michael E. Porter, Competitive Advantage: Creating and Sustaining Superior Performance (1985). On core competence, see C.K. Prahalad and Gary Hamel, "The Core Competence of the Corporation," Harvard Business Review, May–June 1990. https://hbr.org/1990/05/the-core-competence-of-the-corporation ↩ ↩2
-
Jay B. Barney, "Firm Resources and Sustained Competitive Advantage" (Journal of Management, 1991). ↩
-
The origin of the framework is Jay B. Barney, "Firm Resources and Sustained Competitive Advantage," Journal of Management 17(1), 1991, pp. 99-120 https://doi.org/10.1177/014920639101700108 which sets out four indicators: value, rareness, imitability, and substitutability (the stage referred to above as VRIN). Barney's 1995 article is "Looking inside for competitive advantage," Academy of Management Executive (now Academy of Management Perspectives) 9(4), 1995, pp. 49-61 https://doi.org/10.5465/ame.1995.9512032192 which presents an approach for analyzing a firm's internal resources for competitive advantage. On the origin of market segmentation, see Wendell R. Smith, "Product Differentiation and Market Segmentation as Alternative Marketing Strategies," Journal of Marketing 21(1), 1956, pp. 3-8 https://doi.org/10.1177/002224295602100102 ↩