Hello, this is Ryuta Hamamoto from TIMEWELL.
When I wrote about the CIA director's Moscow trip recently, I added a few lines noting that the Strait of Hormuz remains effectively closed: three transits on 23 August against a normal rate of around 85 a day.
What nagged at me while writing was how that figure of three came about. Did traffic stop suddenly, or thin out gradually? And what became of the reopening that was expected in April?
The daily data is public, so I aggregated 512 days of it. The conclusion first: traffic collapsed in three days and has not recovered since.
How I counted, and what is not being counted
The data is IMF PortWatch's daily chokepoint transit series. PortWatch is run jointly by the IMF and Oxford's Environmental Change Institute, counting transits from AIS signals. I took it from a site that redistributes it as a daily CSV.
Coverage is 512 days, 30 March 2025 to 23 August 2026, with three fields: total, tankers, cargo ships.
The limitation first. PortWatch counts only vessels broadcasting AIS, which is not a minor footnote here. GPS jamming, AIS spoofing and deliberate switch-offs are reported in this area. On the same date, another indicator showed 73 tankers had gone dark out of 171 screened. Actual transits may exceed what appears here.
I still think the data is worth using, because the same measurement runs across the whole period. Understated in absolute terms, it still lets you compare before and after on one ruler.
As a cross-check, my aggregate for 23 August 2026 is three vessels (one tanker, two cargo), matching the tracker's own display.
Replace siloed classification work with AI.
METI's FY2024 data shows 52% of foreign exchange law violations stem from classification errors. Download the TRAFEED product catalog covering features and rollout.
The collapse took three days
First, when it stopped.
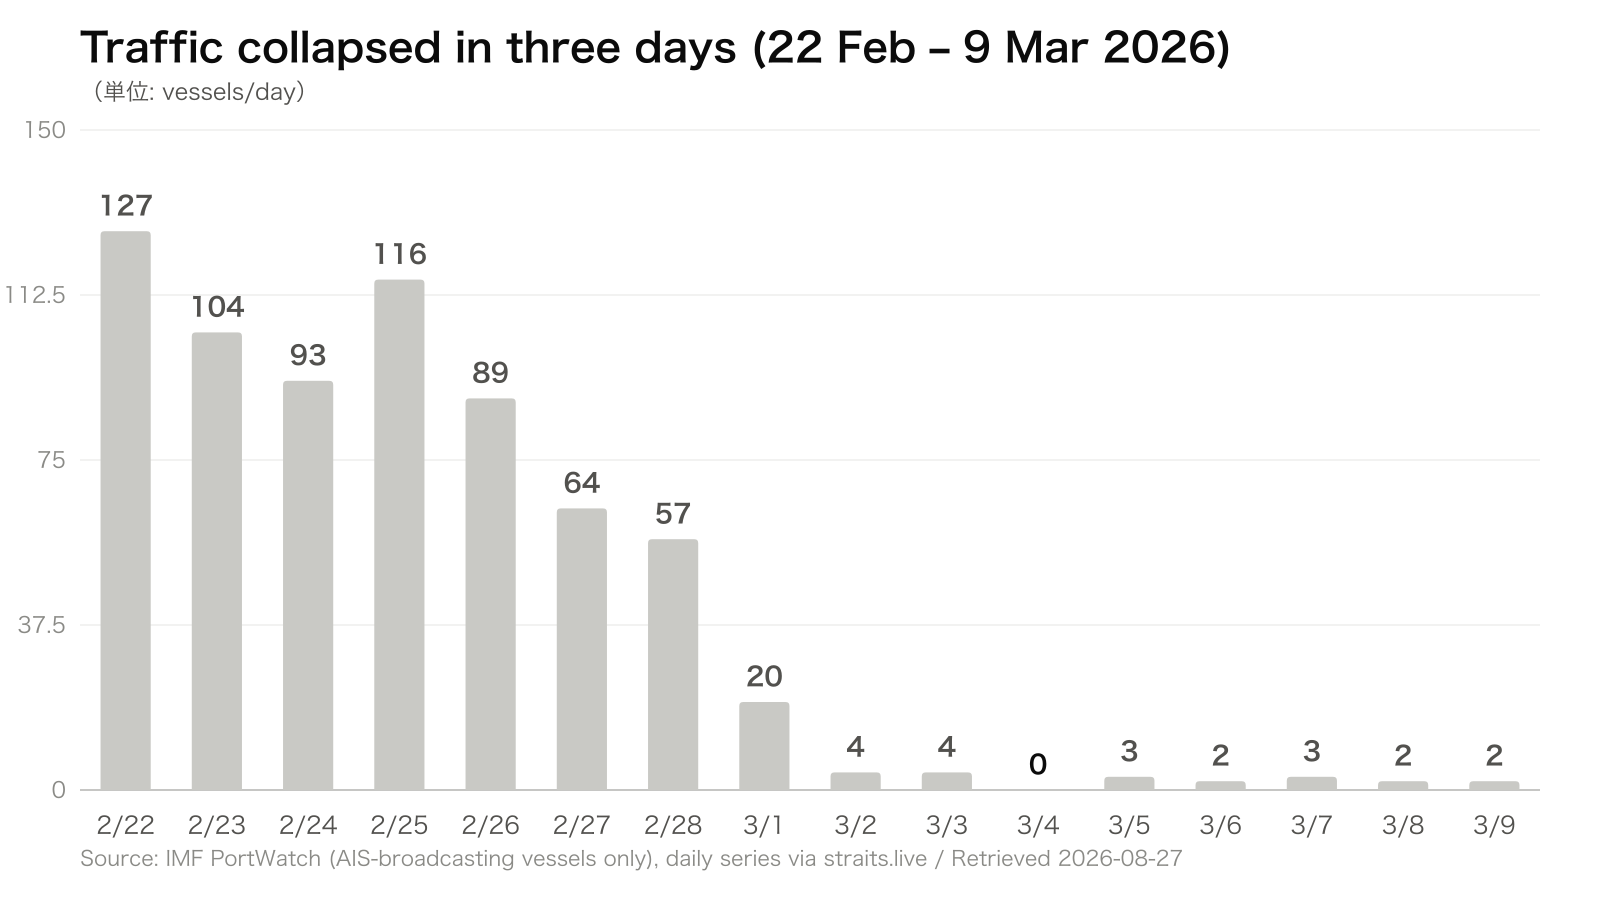
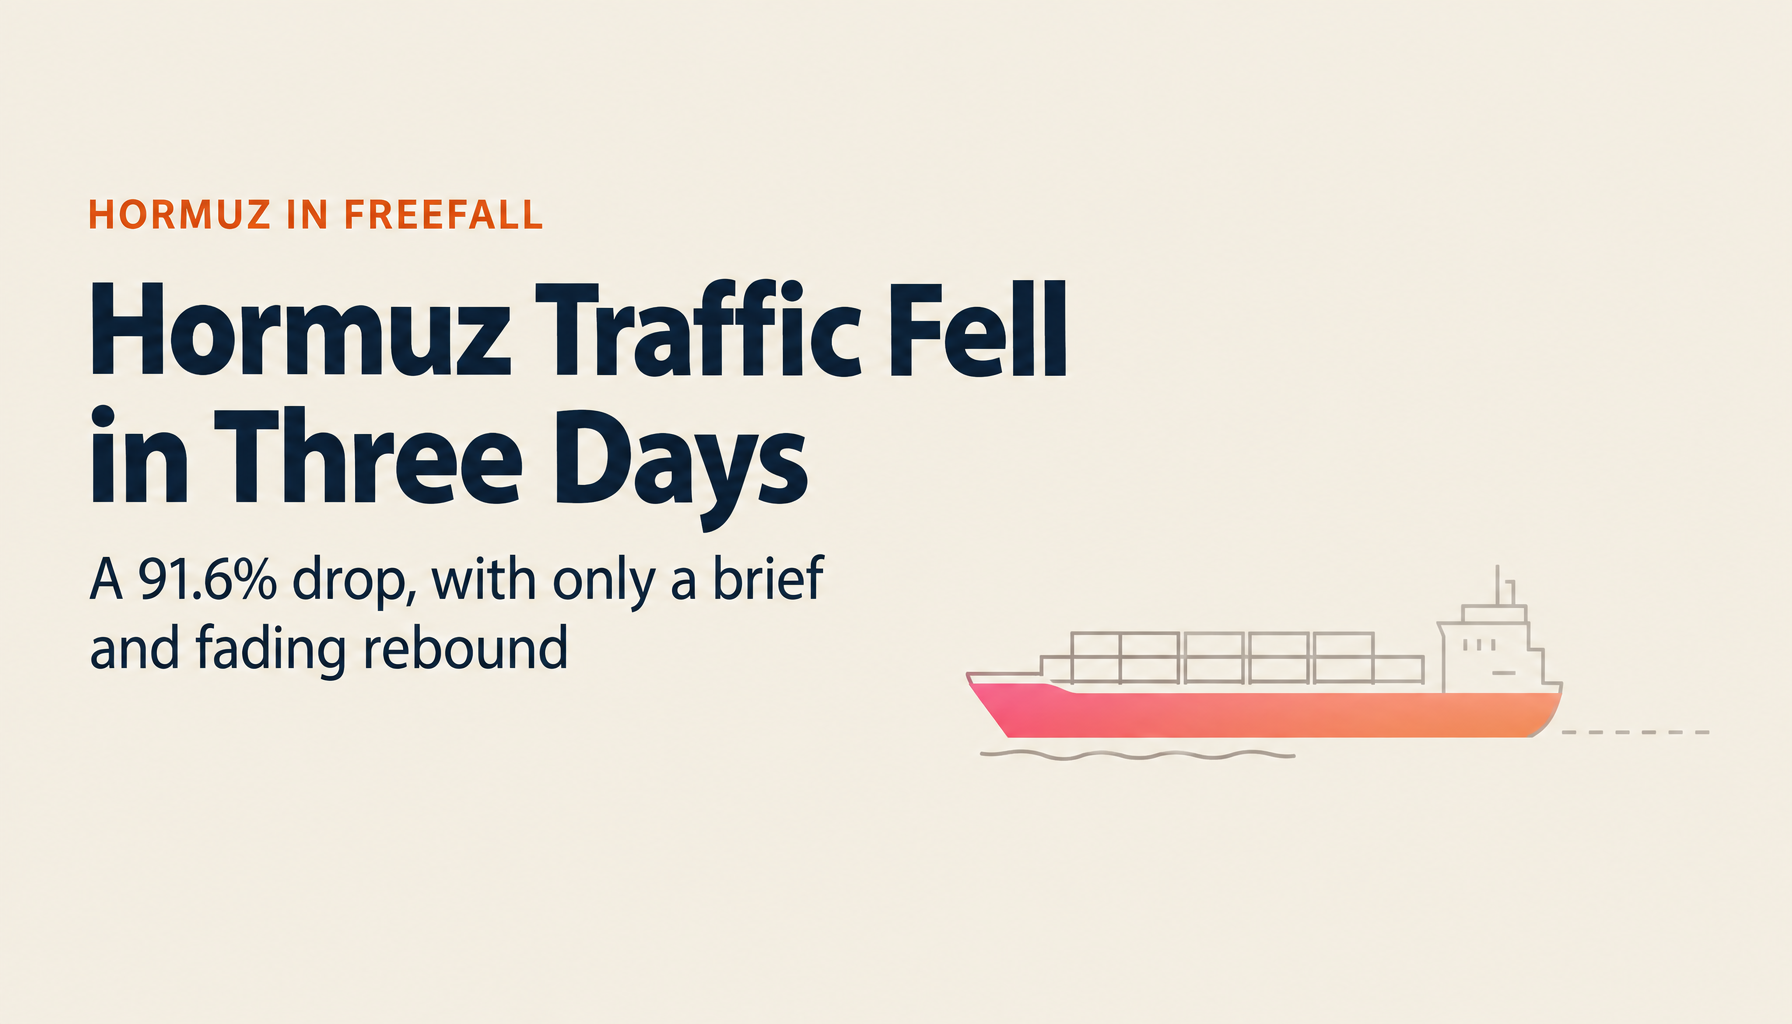
On 22 February 2026, 127 vessels transited — the highest single day in the 512. Then 57 on 28 February, 20 on 1 March, 4 on 2 March, and zero on 4 March.
From 127 to 4 in effectively three days.
I had imagined something more gradual. Shipping runs on contracts and voyage plans, so I assumed traffic would coast for weeks after any policy change. It did not. The moment danger is confirmed, ships stop at once. Seeing it in the data changed my sense of how fast maritime decision-making moves.
There were 12 days of zero transits in total, scattered up to 23 July 2026.
Down 91.6%, and not recovering
Now before and after.
| Period | Days | Daily average |
|---|---|---|
| Before closure (30 Mar 2025 – 19 Feb 2026) | 327 | 84.8 vessels |
| After closure (1 Mar – 23 Aug 2026) | 176 | 7.1 vessels |
A 91.6% decline. But those two figures alone hide the most important part. Break it out by month and the picture changes.
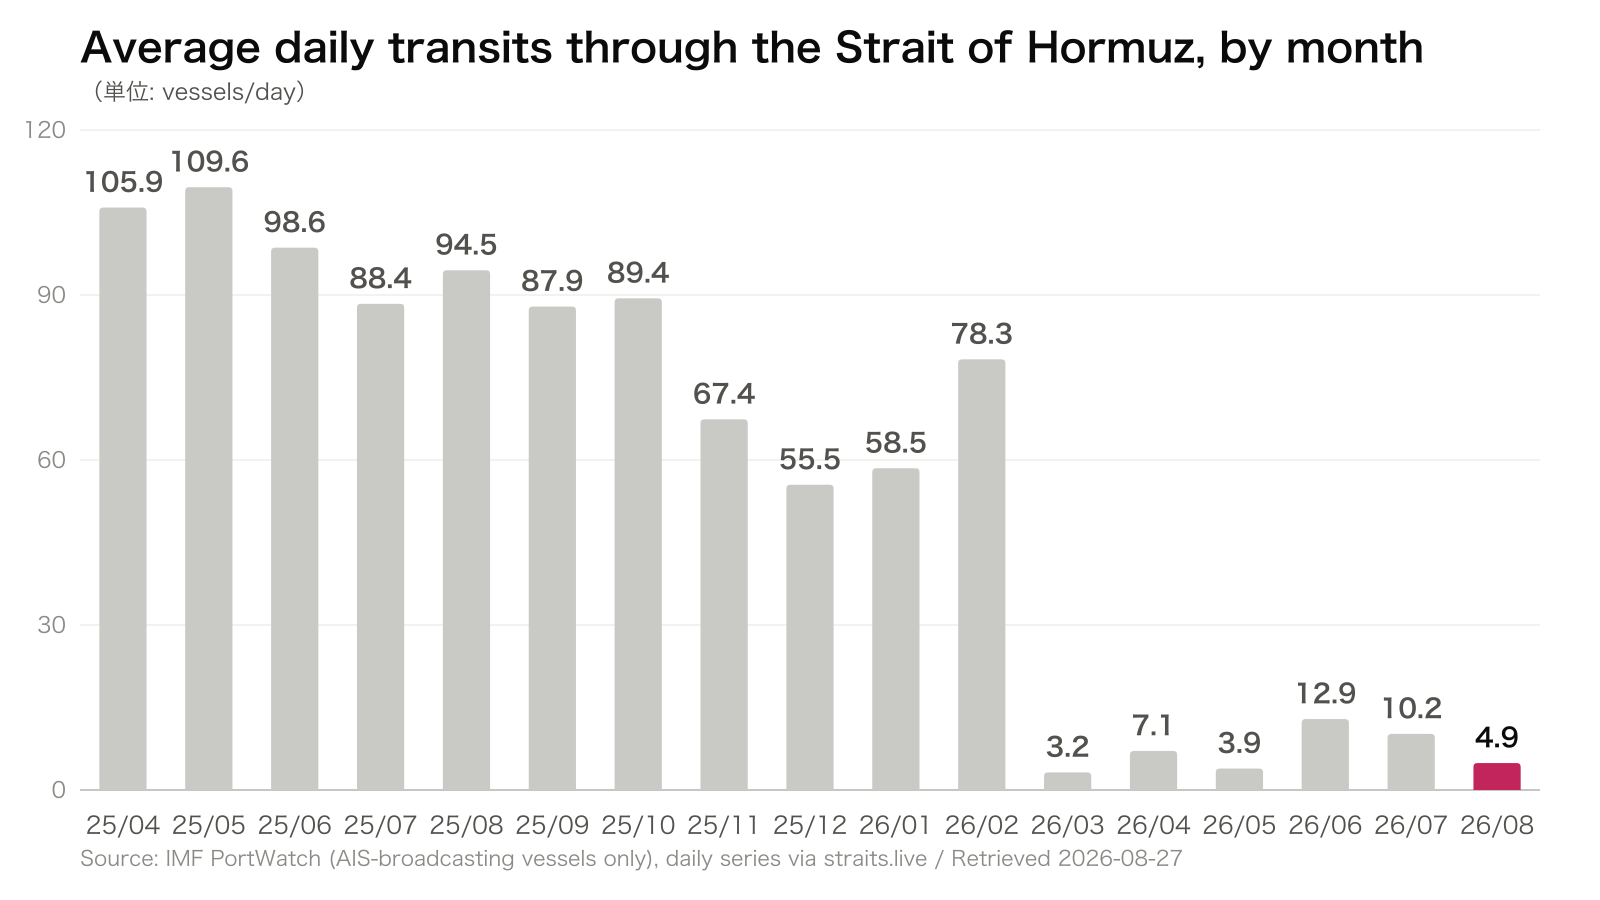
After falling to 3.2 in March, traffic reached 7.1 in April, 3.9 in May, and 12.9 in June — coinciding with reports of reopening under a ceasefire framework. Read alone, that looks like recovery.
Then July at 10.2 and August at 4.9. Falling again.
That reversal is the part I consider most important. Coverage moves whenever a reopening agreement is announced, but whether ships actually sailed is a separate question. In the data, the slight June recovery is back at March and May levels by August. The trailing 30-day average is 4.9, with a minimum of one vessel in a day.
Laying the months out also surfaced something else. Traffic was already falling before the closure. From 89.4 in October 2025 to 67.4 in November and 55.5 in December, then 58.5 in January 2026 — nearly 40% off. February recovered to 78.3, and then the collapse came.
So the sequence was not "normal one day, closed the next" but already thinning, then a final blow. That first stage only shows up when daily data is smoothed into months.
Tankers fell further
Splitting by vessel type sharpens it again.
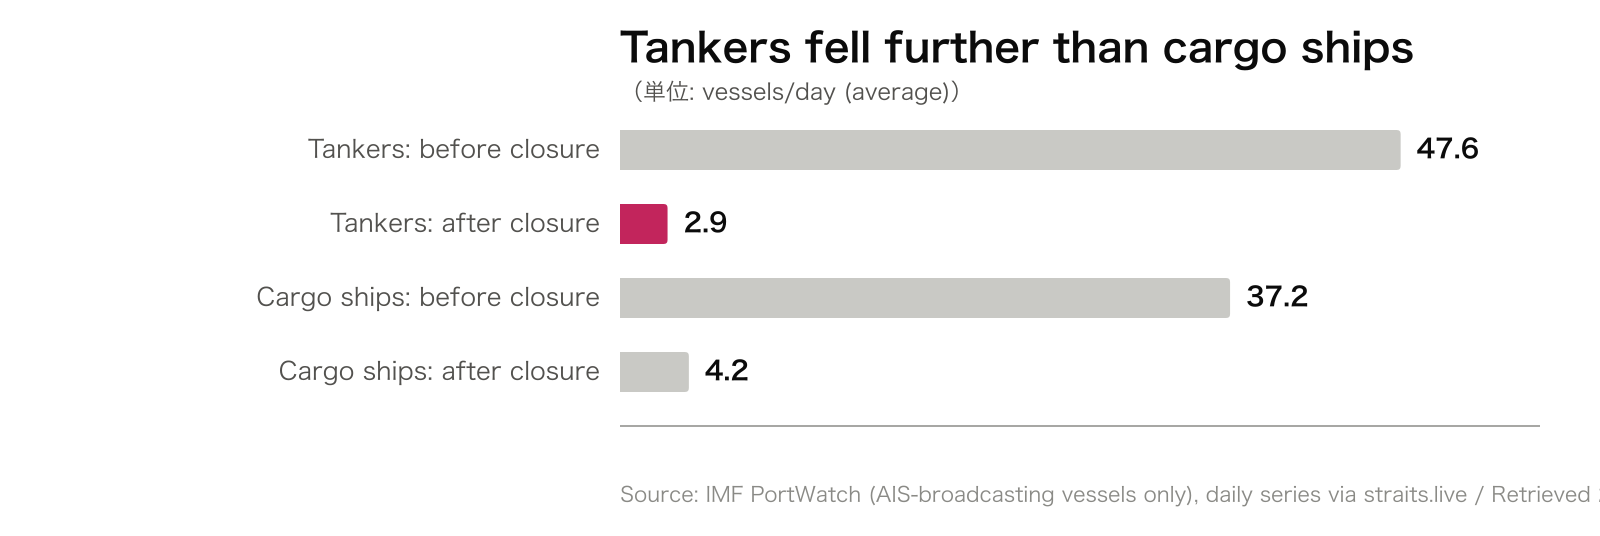
Tankers went from an average of 47.6 a day before to 2.9 after, down 93.8%. Cargo ships went from 37.2 to 4.2, down 88.8%.
Five points apart, but the consequence is not small. Tankers outnumbered cargo ships before the closure; afterwards cargo ships outnumber tankers. The order flipped.
I have no data that establishes why, though the difference in risk appetite is easy to imagine. War risk premiums for a VLCC are reported at 40 times normal, around $10 million per voyage. With hull values and cargo values an order of magnitude higher, tankers turn conservative faster. Oil flow stops first.
For Japan that is the sore point. Most of its imported crude has historically come through this strait. What stops first is what matters most.
Where did the stopped ships go?
Traffic falling does not mean the ships vanished. Other indicators from the same date show where they went.
1,078 vessels are stranded inside the Persian Gulf. With 127 transiting, that is roughly eight times as many ships sitting still.
Among operators, eight of the nine identified had chosen to reroute, with zero suspending service. So the response is not waiting but going around. A Cape of Good Hope routing adds thousands of nautical miles and roughly two weeks between Asia and Europe — freight and lead time, directly.
Insurance has moved as noted: war risk cover at 40 times normal. Brent sits at $86.29, which looks calm relative to the depth of the crisis. That surprised me too. But reading it as "limited impact" would be premature: price is absorbed first by rerouting and inventory, and shows up as cost later.
The AIS point matters again here. Of 6,975 vessels tracked, 171 were screened and 73 tankers had gone dark. Where those ships are is not knowable from this figure. It is, though, the basis for my caveat at the top. What gets counted is only what chose to be countable.
What to take into practice
Interpretation from here.
First, treat "expected reopening" and actual transits as different things. June's 12.9 was a slight recovery against considerable coverage, and by August it was gone. Running supply chain plans off headlines gets you whipsawed. Keep one indicator of volume actually moved. How long the closure may last, and what reopening would take, is tracked in how long the Strait of Hormuz closure will last, as of October 2026. On governments' positions, Prime Minister Takaichi and President Macron both raised freedom of navigation at the September UN General Debate; see our summary of the UNGA 2026 General Debate and leaders' security positions.
Second, learn from the fact that there was a first stage. Between November 2025 and January 2026 traffic was already 40% down. Whether you noticed then is the difference. The crisis showed up in the numbers before it showed up in the news.
Third, recognise that supply chain problems and export control problems are continuous. When shipping is constrained, alternative routes, alternative sources and inventory builds all start moving. New counterparties mean new due diligence. And it is precisely in an emergency that people want to skip the check.
Fourth, rerouting arrives later as cost. Eight of nine operators reroute, zero suspend. Logistics has not stopped. But not stopping is not the same as no impact. Cape routing days and fuel, higher premiums, demurrage on 1,078 waiting ships — these land in procurement prices months later. I would not read today's calm oil price as reassurance.
That is why running screening and classification in peacetime pays. TRAFEED supports classification against METI criteria and counterparty screening, with final classification resting with your own export control officer. To place your own company first, start with our three-minute export compliance check.
In summary
- 512 days, 30 March 2025 to 23 August 2026, IMF PortWatch AIS basis
- 327 days before closure averaged 84.8 vessels/day; 176 days after averaged 7.1. Down 91.6%
- The collapse took three days: 127 on 22 Feb → 20 on 1 Mar → 4 on 2 Mar → 0 on 4 Mar
- 12 days of zero transits
- June recovered to 12.9, then July 10.2 and August 4.9. No recovery
- Traffic was already 40% down before the closure (Oct 2025: 89.4 → Dec: 55.5)
- Tankers down 93.8%, cargo down 88.8%. After closure, cargo ships outnumber tankers
- 1,078 vessels stranded in the Gulf, roughly eight times the 127 transiting. Eight of nine operators reroute; none suspended
- War risk premiums at 40x normal; Brent relatively calm at $86.29
- AIS-broadcasting vessels only. 73 of 171 screened tankers had gone dark. Actual transits may exceed these figures
What stayed with me is that 127 to zero took three days. Supply chain planning assumes gradual substitution; in practice the switch in judgement was instantaneous.
Recovery, meanwhile, has taken five months and has not arrived. Three days to break, years to rebuild. That asymmetry is what shipping and procurement teams are living with right now.
If you want to talk through counterparty checks or building an export control programme as supply chains shift, talk to us directly.
Source: IMF PortWatch, "Daily Chokepoint Transit Calls and Trade Volume Estimates" (AIS-broadcasting vessels only), redistributed as a daily CSV at https://straits.live/data/transits.csv . 512 days (30 March 2025 – 23 August 2026) retrieved and aggregated on 27 August 2026. Insurance and dark-vessel figures are that site's display on the same date.